
Chicago home sales faced an unfortunate drop at the tail end of 2018, with citywide overall residential housing sales down 15.8 percent from one year prior. Chicago condo sales, too, fell 15.4 percent.
Chicago homes for sale took a median of 51 days to sell, which was exactly the same number of days from December 2017. But condo sales were slower year-over-year with a 10.4 percent rise to 53 days.
The median home price in Chicago fell to $246,750 in December, down 7 percent from one year earlier and at its lowest level since February 2017.
Meanwhile, Chicago’s median condo price fell 9 percent year-over-year to $285,000. That’s the lowest it’s been since September 2016, when the median price was just a few thousands more at $287,000.
Chicago home prices by neighborhood

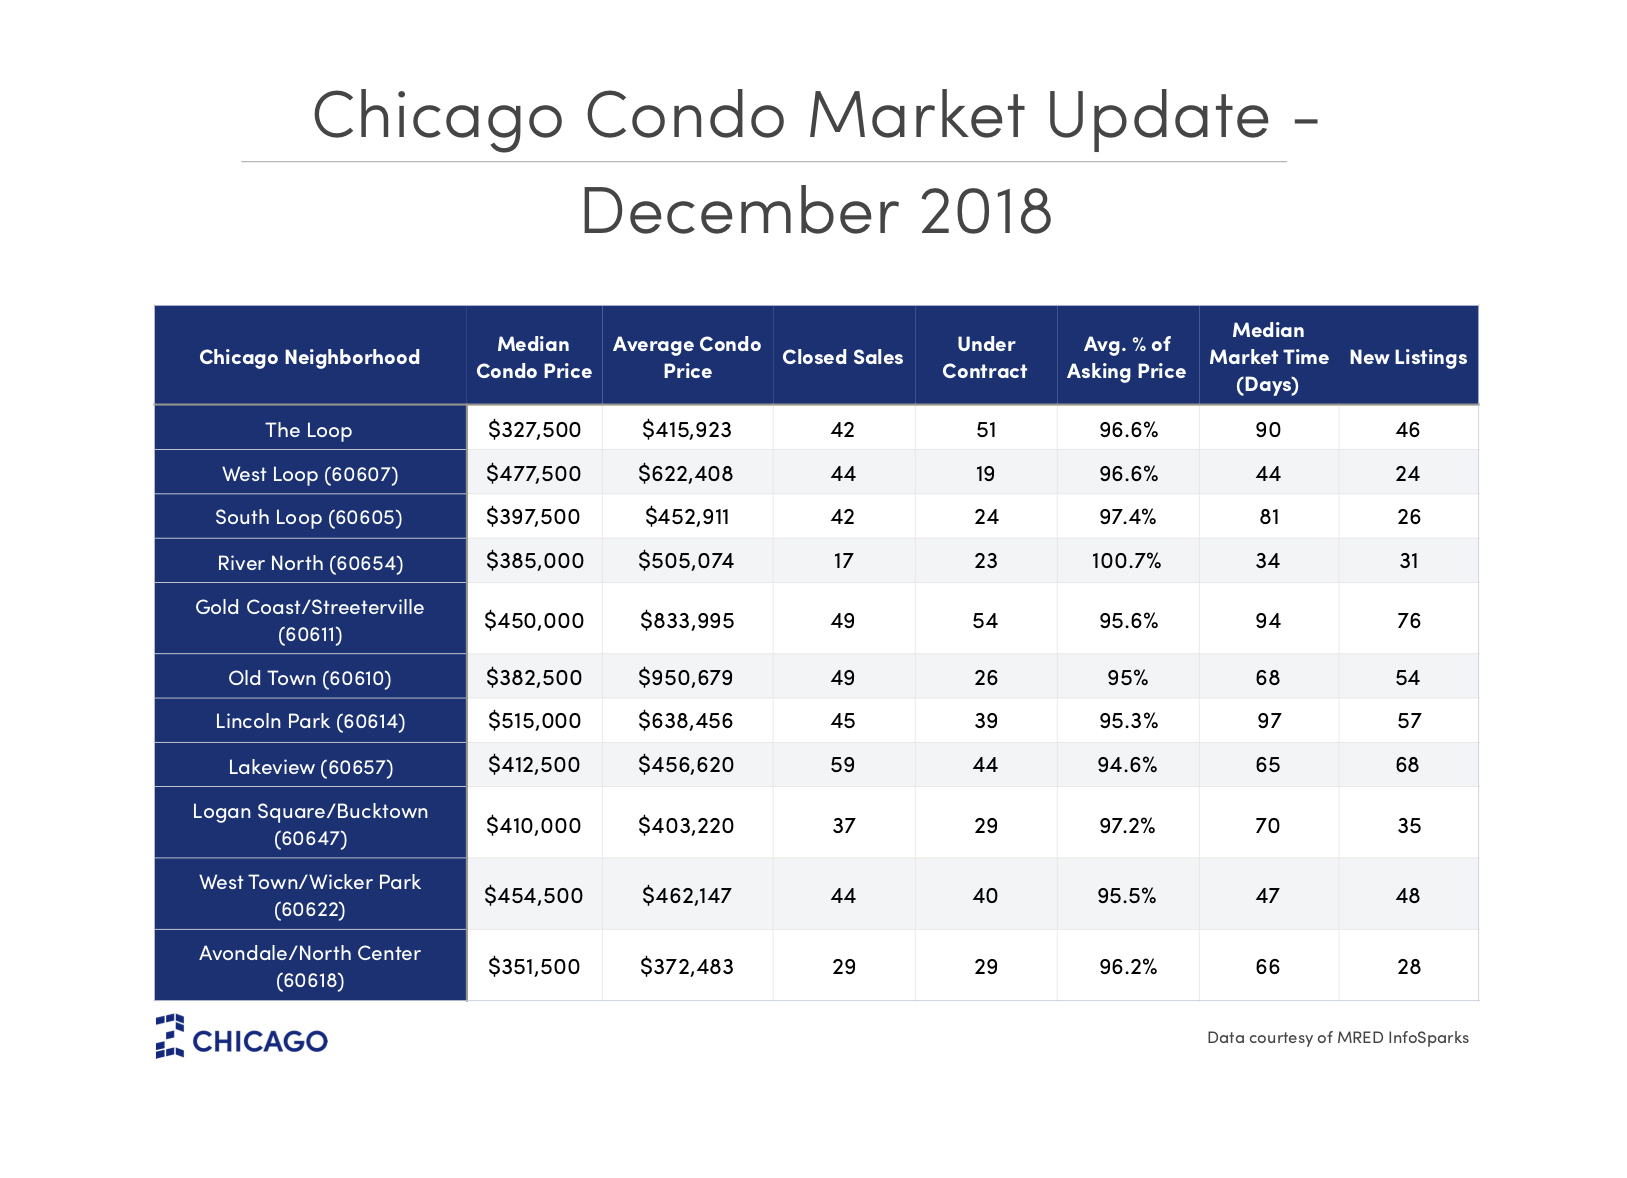
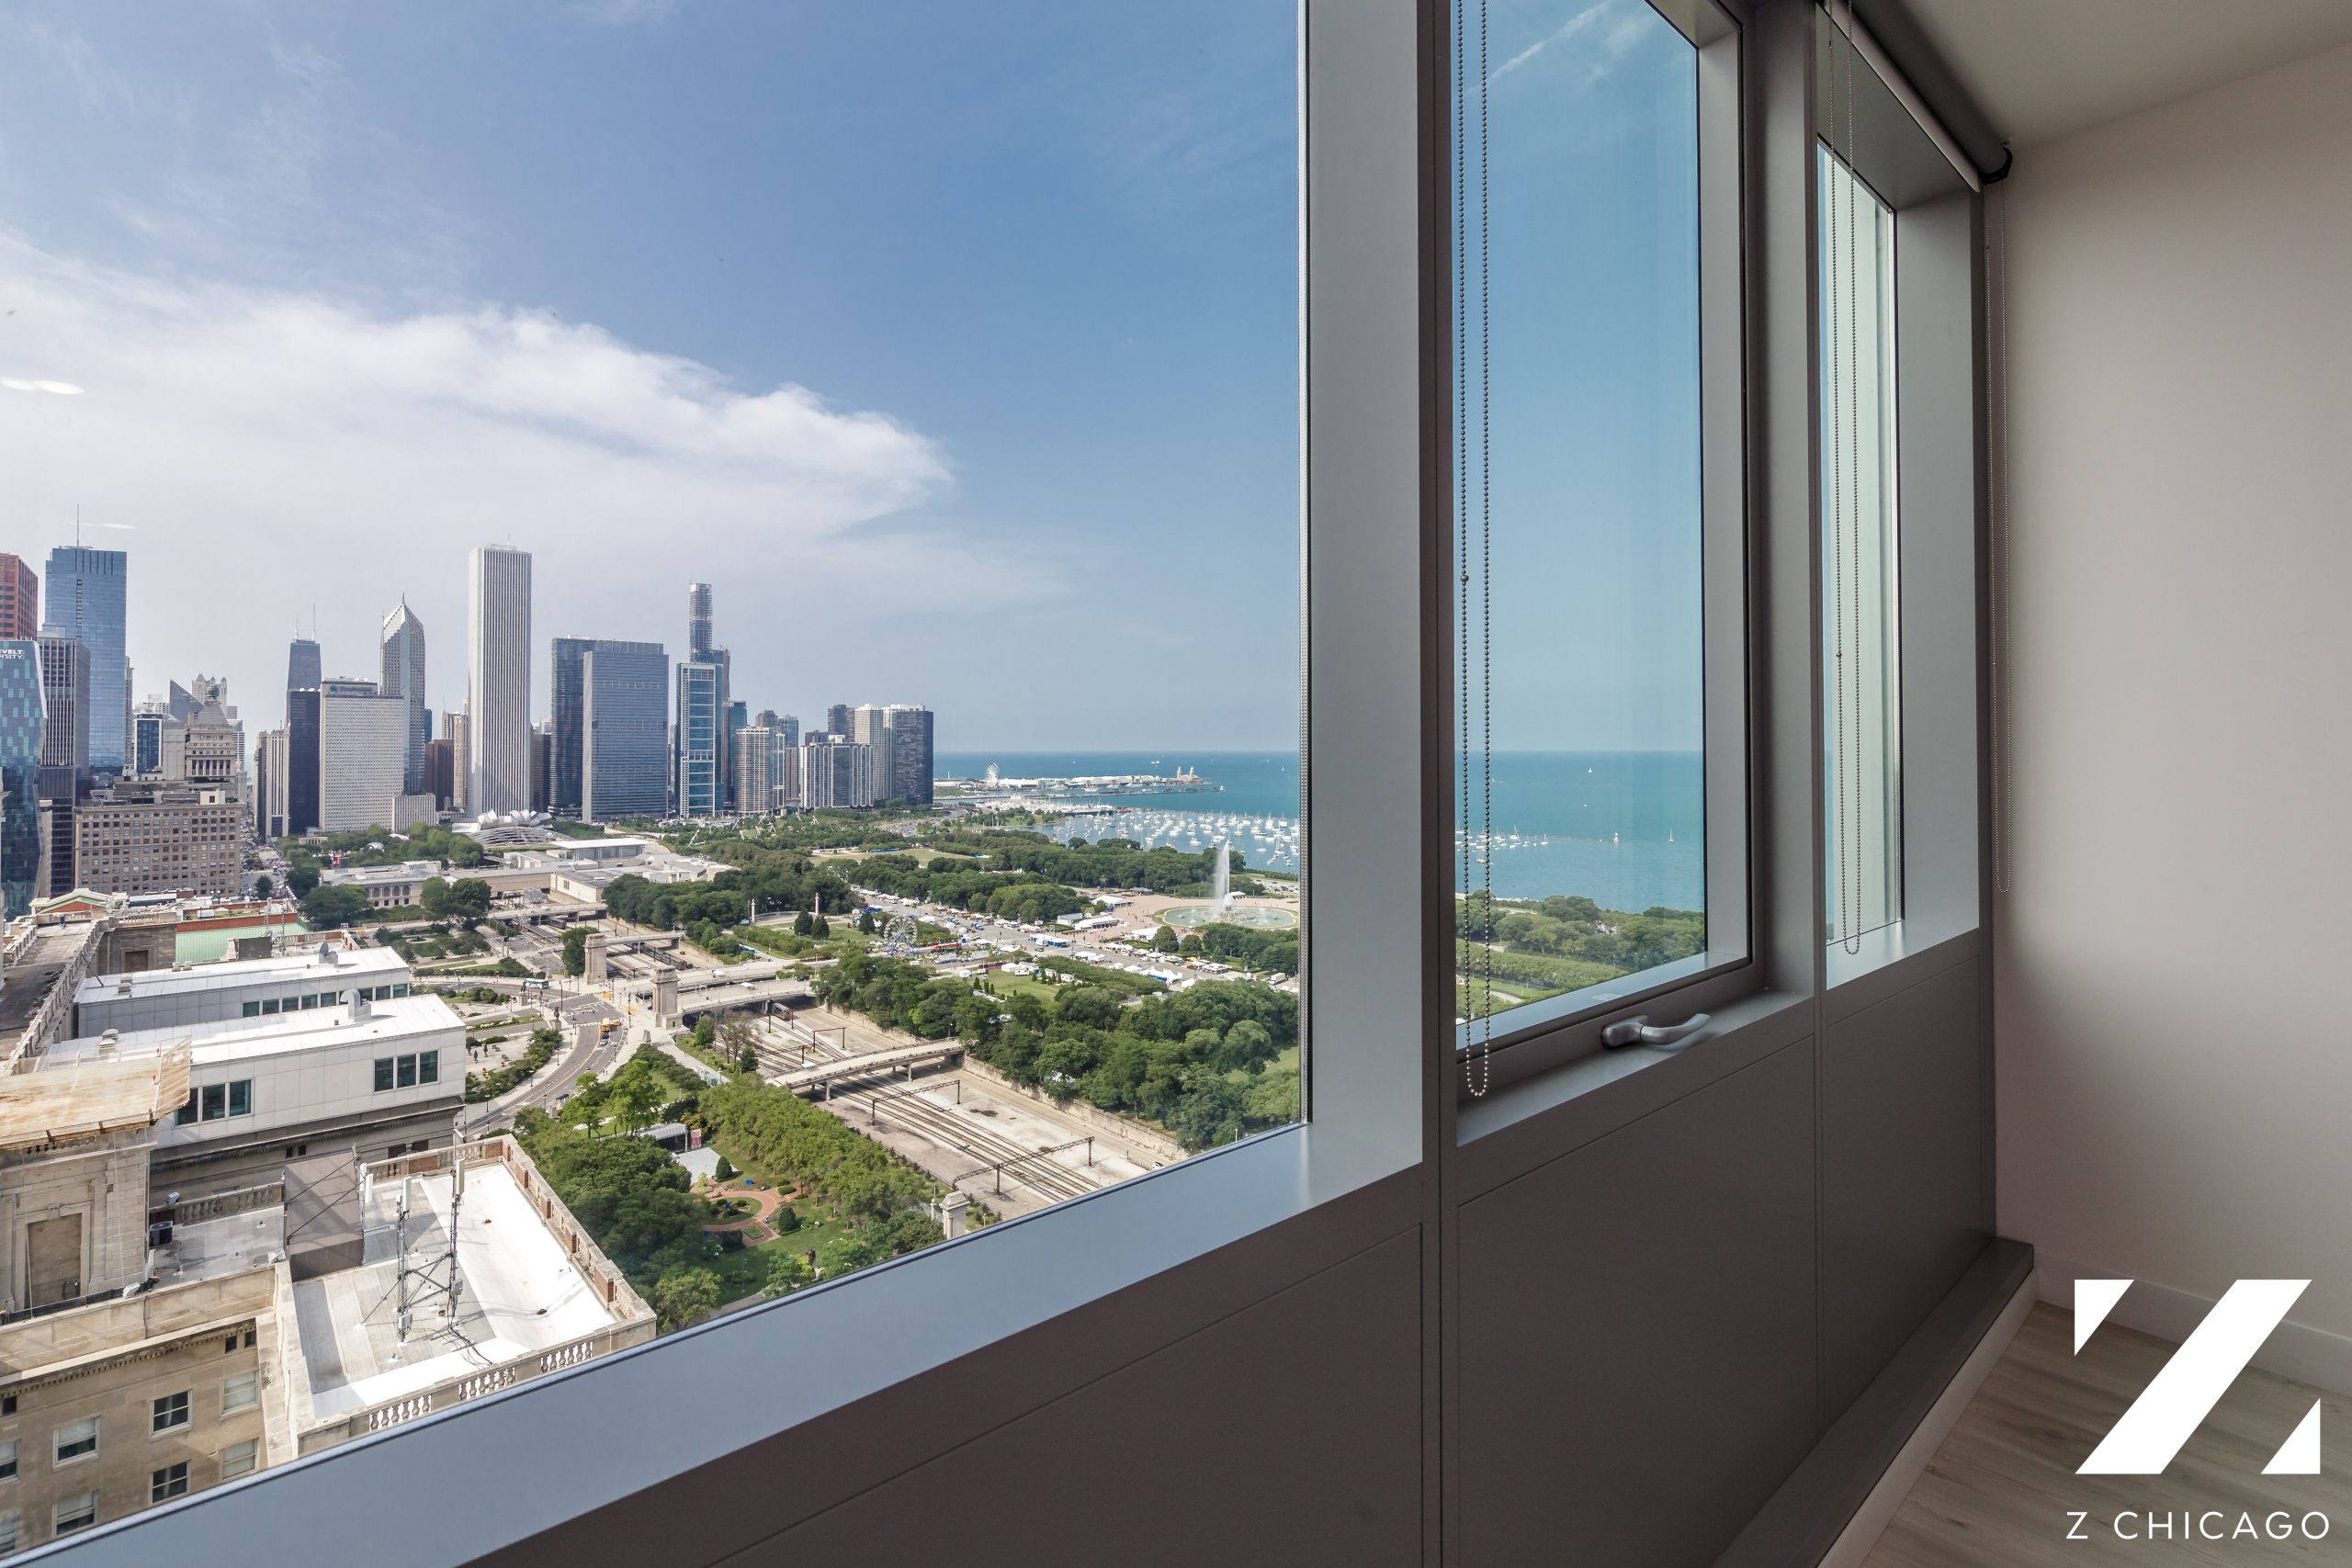
The Loop, Chicago
- Home prices in the Loop rose 4.1%
- Market time in the Loop rose 23.3%
- Closed sales fell 27.6%
- New listings rose 27.8%
West Loop, Chicago
- West Loop home prices rose 9.3%
- West Loop market time rose 4.1%
- Closed sales fell 23%
- New listings fell 35%
South Loop, Chicago
- South Loop home prices rose 20.4%
- Market time rose 44.4%
- Closed sales fell 6.3%
- New listings rose 7.1%
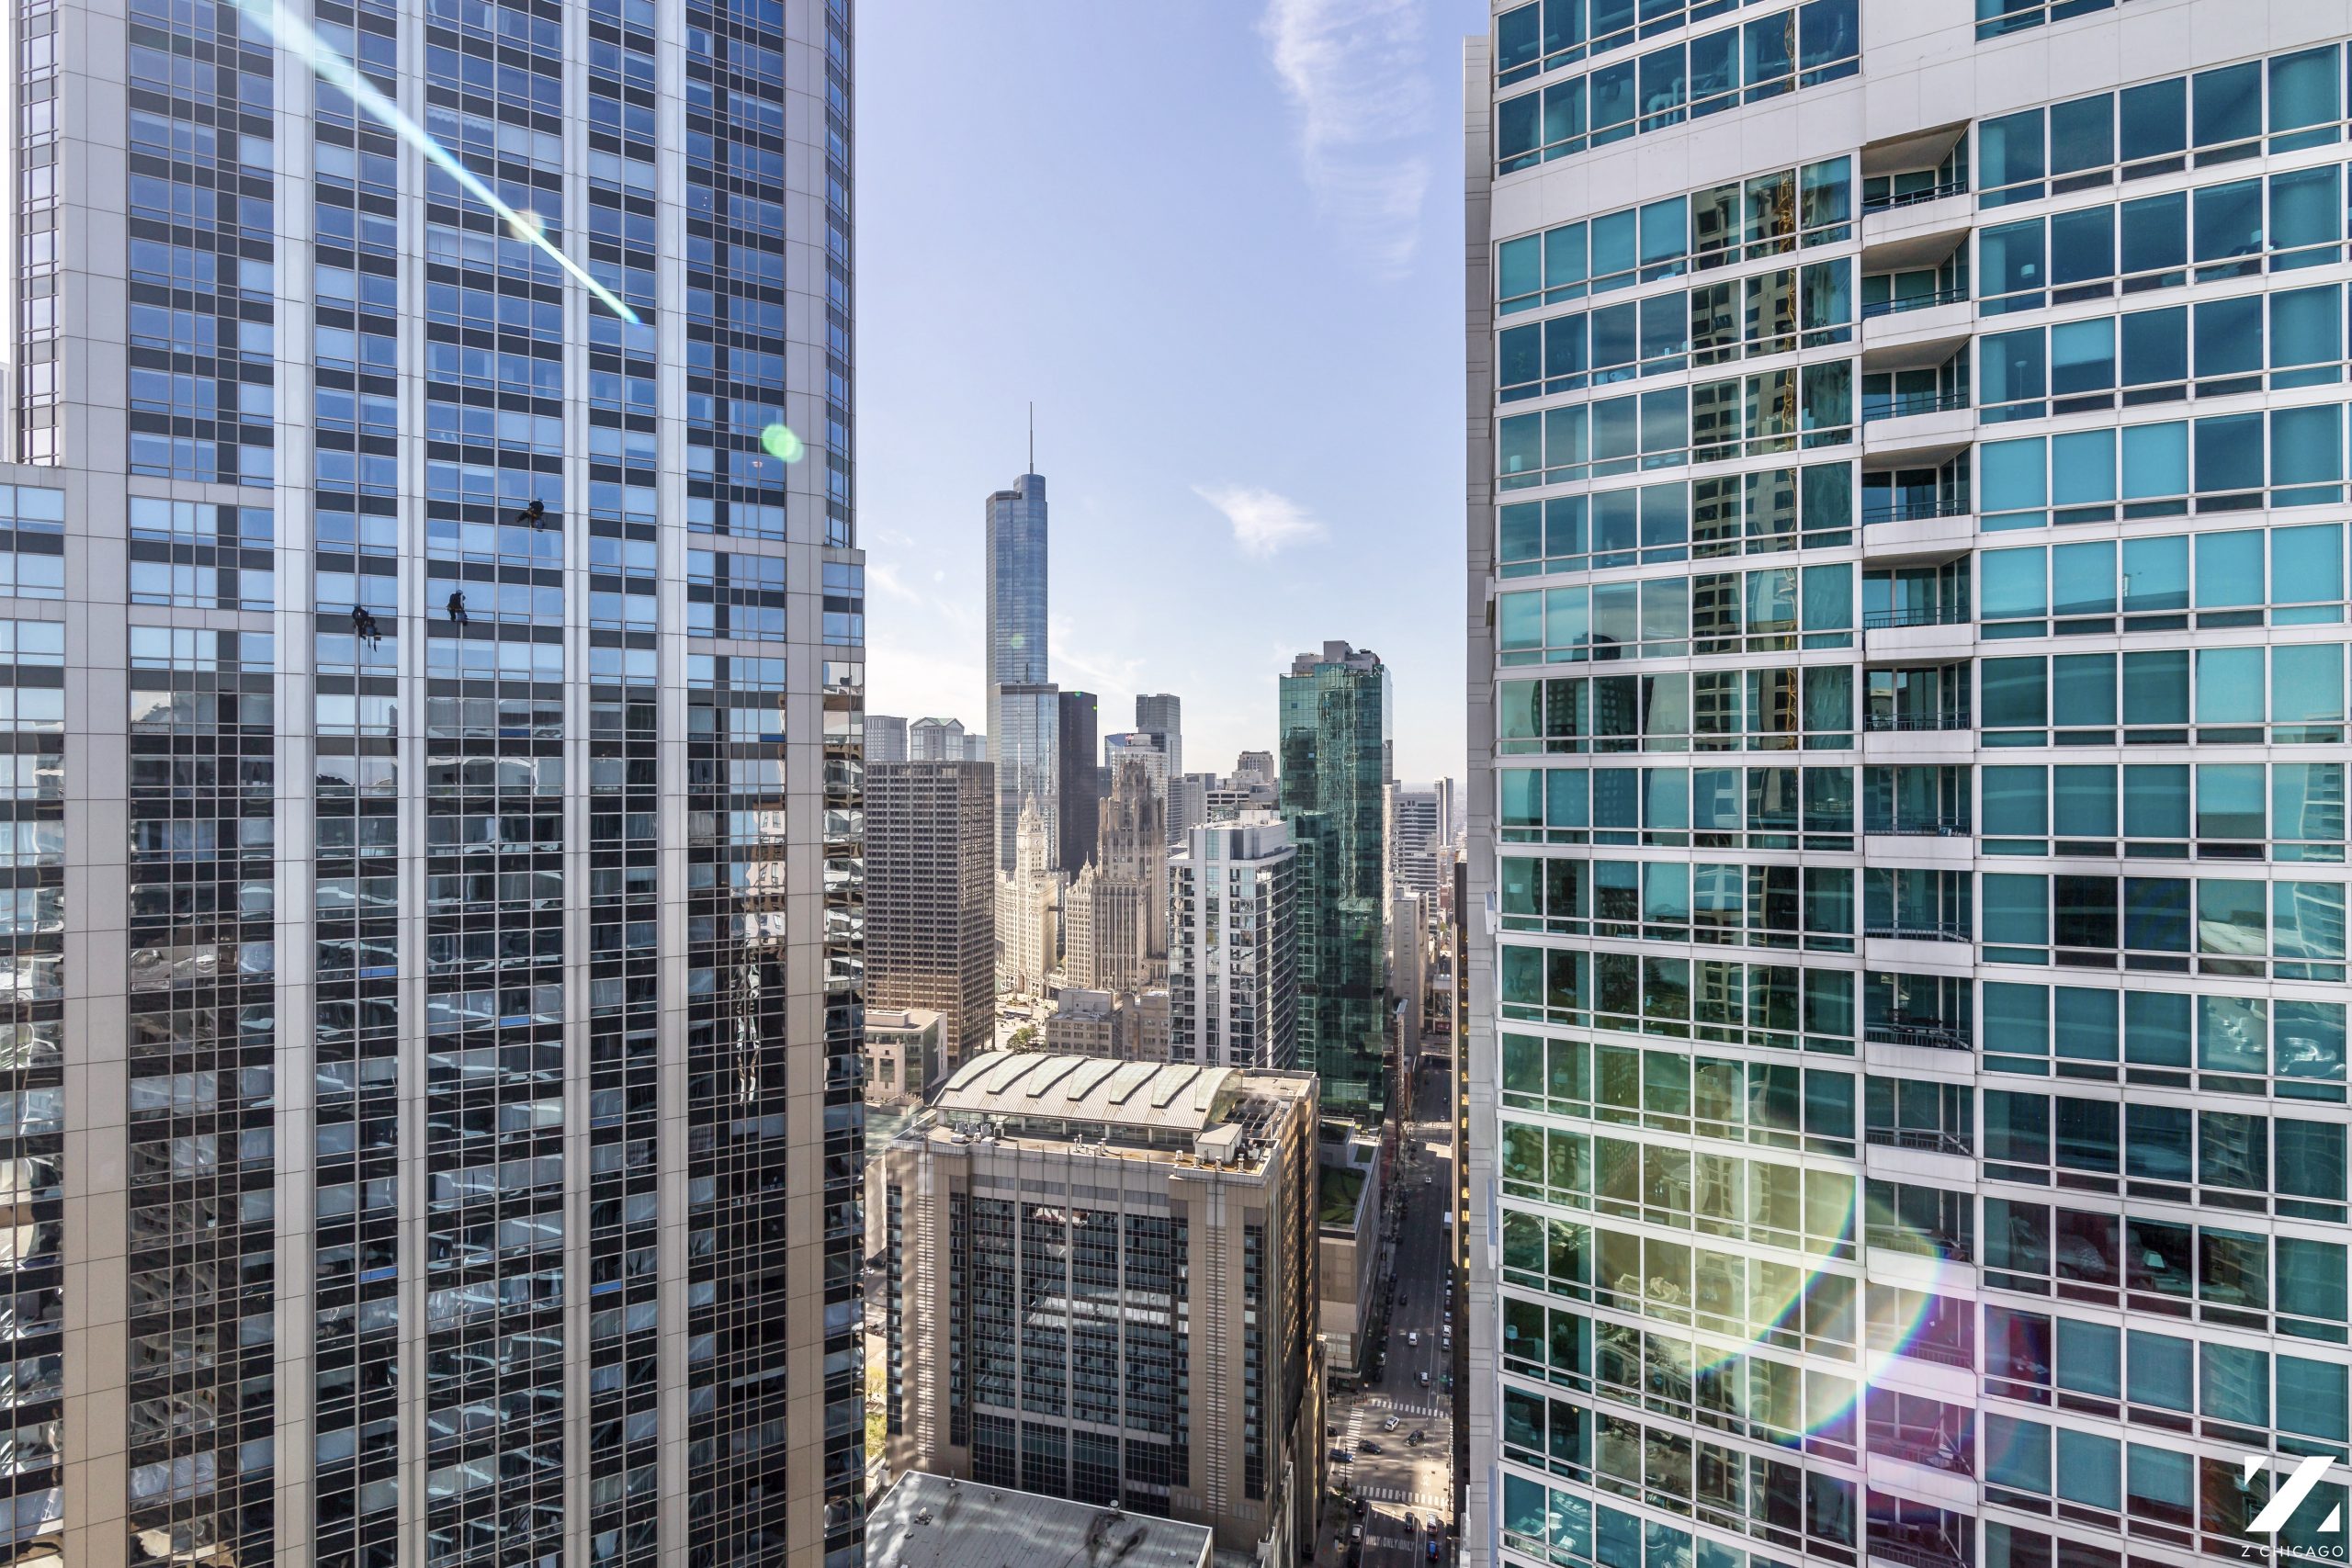
River North, Chicago
- River North home prices fell 6.7%
- Market time rose 169%
- Closed sales fell 59.6%
- New listings fell 26.2%
Gold Coast/Streeterville, Chicago
- Gold Coast and Streeterville home prices rose 11.1%
- Market time rose 22.1%
- Closed sales fell 44.3%
- New listings fell 10.6%
Old Town, Chicago
- Old Town home prices fell 19.1%
- Market time rose 6.1%
- Closed sales rose 4.2%
- New listings rose 3.7%
Lincoln Park, Chicago
- Lincoln Park home prices fell 7.9%
- Market time rose 148.6%
- Closed sales fell 48.5%
- New listings fell 25.5%
Lakeview, Chicago
- Lakeview home prices fell 6%
- Market time rose 27.5%
- Closed sales fell 19%
- New listings rose 23.4%
Logan Square/Bucktown, Chicago
- Logan Square and Bucktown home prices fell 6.1%
- Market time rose 36.8%
- Closed sales fell 11%
- New listings rose 73.5%
West Town/Wicker Park, Chicago
- West Town and Wicker Park home prices fell 8.6%
- Market time rose 29.7%
- Closed sales fell 31.9%
- New listings fell 14.7%
Avondale/North Center, Chicago
- Avondale and North Center home prices rose 2.4%
- Market time rose 22.2%
- Closed sales fell 13.8%
- New listings rose 2%
Chicago homes and condos are sitting on the market longer
In December, homes sat on the market longer in every major downtown neighborhood compared to just one year ago. This slowdown, adjusted for seasonality, could be due to a number of events that occurred in Q42018.
First, uncertainty over the economy, illustrated in a highly volatile stock market over the year, likely had an impact on buyers’ willingness to invest in real estate. Mid-term elections and political changes could have also influenced buyers’ decisions to hold off as compared to late 2017.
Finally, and perhaps the most important in relation to Chicago’s real estate market, the US Federal Reserve raised benchmark interest rates a total of four times in 2018. Mortgage rates were up almost a full percentage point in 2018. Fortunately, economists believe the year ahead will be steadier for mortgage rates with lesser surges over the next few quarters. The Mortgage Banker Association expects the average 30-year fixed mortgage rate to hover around 5.1 percent for the majority of 2019.
To learn more about the Chicago real estate market and its current health, stay tuned for our 2018 market overview and 2019 market forecast.
