It may feel chilly outside, but the Chicago real estate market is just beginning to heat up. Every March, Realtors across the Windy City prep their clients for the busy sales season. If you think you may be one of the many Chicago residents to buy or sell this spring, keeping up on the most recent real estate trends – both citywide and community-specific – is a must.
According to Illinois REALTORS monthly local market update for the City of Chicago, home sales in January fell 10.2 percent year-over-year. The big dip in home sales is largely due to a lack of inventory – there were 10.9 percent fewer Chicago homes for sale in January 2018 compared to January 2017. Meanwhile, the median sales price rose 3.9 percent to $265,000 while time on the market dipped 7.3 percent to 51 days.
Newer data from MRED for February puts the latest overall median sales price (residential plus commercial, land and multi-unit sales) in Chicago at $280,000 – up 4.5 percent since last year. Chicago’s residential median sales price was $285,000 – that includes single-family homes, townhomes, and condominiums. Condos specifically were slightly pricier at a median $315,000, up 4 percent since February 2017. These numbers are based on a rolling 12-month average.
Chicago home sales by neighborhood

Compared to February 2017, home prices (including all residential types) rose in three city center neighborhoods – the Loop (19 percent), West Loop (79.2 percent) and River North (1.6 percent). Meanwhile, South Loop home prices dropped 9.4 percent year-over-year.
Lakeview’s median home price rose 26.6 percent while Old Town’s rose a lesser 1.2 percent. Gold Coast/Streeterville home prices dropped 16.8 percent and Lincoln Park home prices dipped 3.7 percent.
The median home price increased in both West Town/Wicker Park (12.7 percent) and Logan Square/Bucktown (3.7 percent). The overall median home price dropped in Avondale/North Center by 5.7 percent.
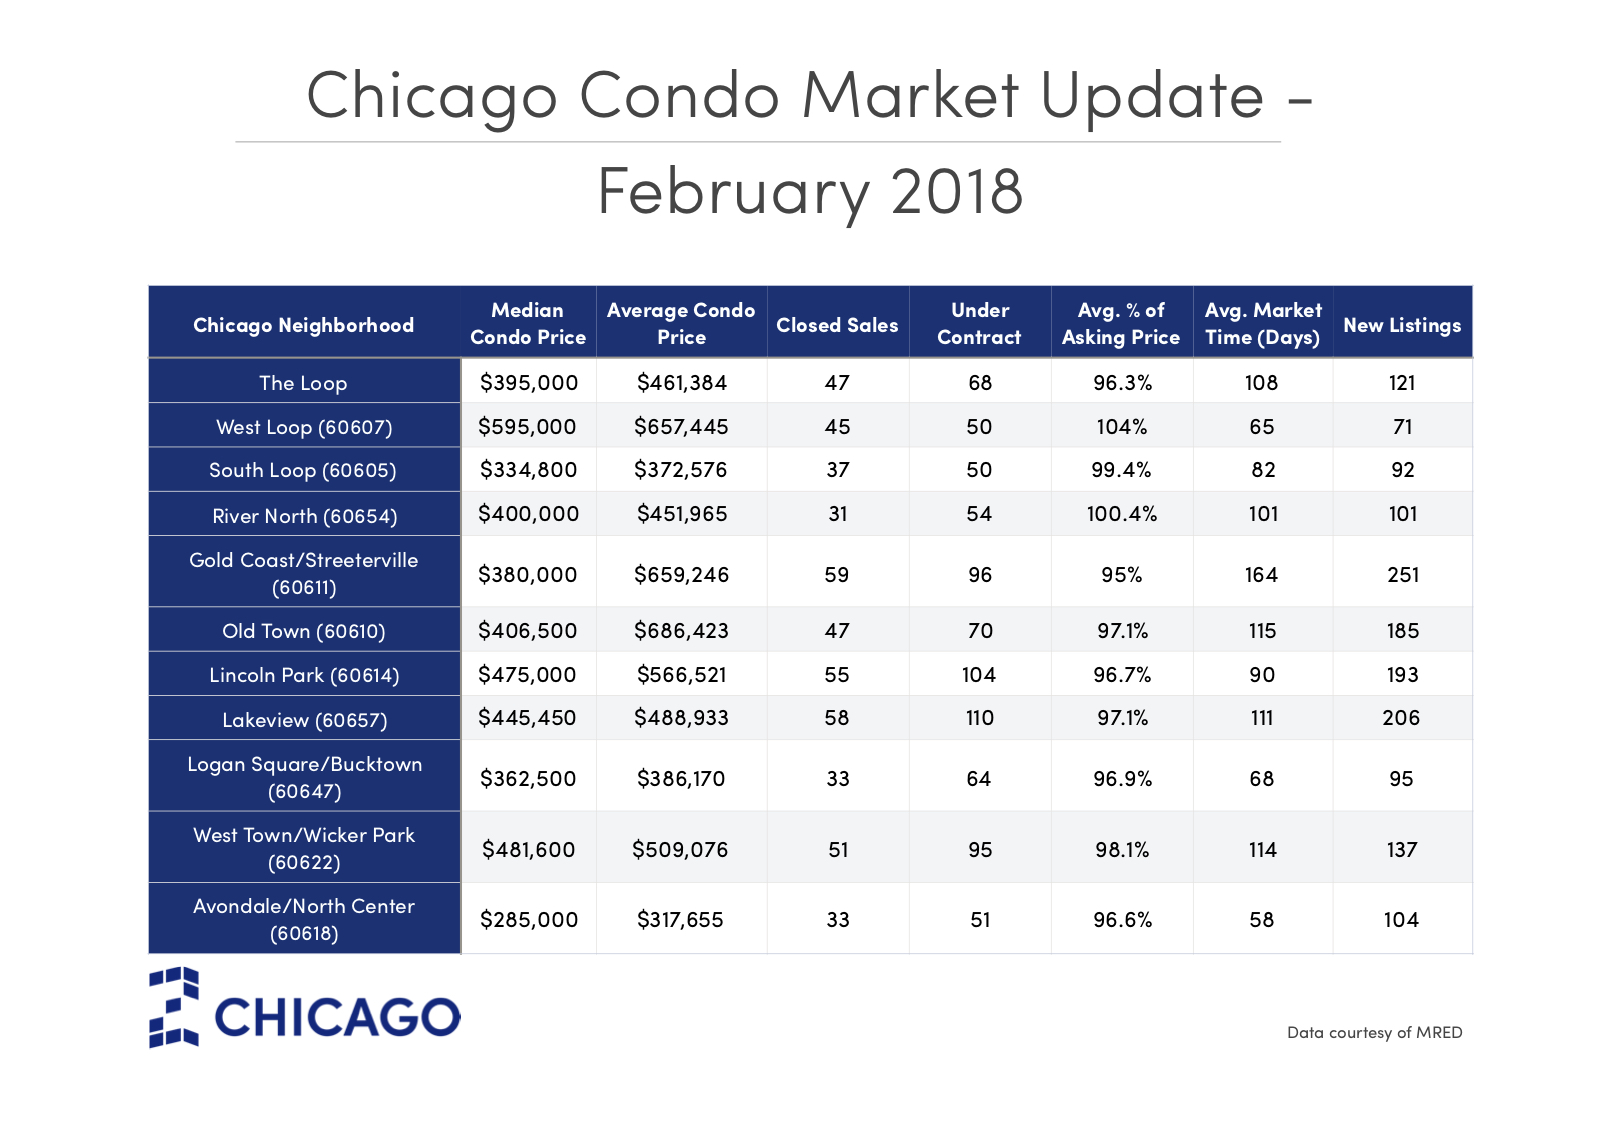
Looking at condo prices specifically, the Loop saw an impressive 19 percent year-over-year increase. However, the shining star this February was the West Loop, where the median condo price jumped 79.8 percent annually. South Loop and River North condo prices rose a slight 1 percent each.
Farther north, Lakeview’s median condo price grew by 23 percent. Old Town condo prices rose 2.2 percent. And, Lincoln Park condo prices rose 6.9 percent. Gold Coast/Streeterville’s median condo price dipped 15.6 percent.
On the northwest side of the city, the median condo price in West Town/Wicker Park and Logan Square/Bucktown rose 18.6 percent and 13.3 percent, respectively. Avondale condo prices fell a dramatic 36.7 percent year-over-year.
Chicago home inventory report
Last month, there were 7,672 homes for sale in Chicago, of which 4,186 were considered new listings.
Neighborhoods with the highest number of new homes for sale in February include Lincoln Park, Lakeview, Gold Coast/Streeterville, and Avondale/North Center. West Loop had the fewest number of new for-sale listings, which could have partially contributed to sellers receiving 103.5 percent of asking price, on average. Low inventory tends to correlate with heightened demand and oftentimes, bidding wars.
The condo market comprised 3,938 listings in February, 2,439 of which just hit the market that month.
Gold Coast/Streeterville had the most new condos for sale in February, followed by Lakeview, Lincoln Park, and Old Town. Again, West Loop came in last for new listings with just 71 new condos for sale in February.
Chicago neighborhoods with the highest home sales
For home sales overall, Lakeview saw the most closings in February compared to the other communities. Yet, closed sales in Lakeview were down 7.3 percent compared to February of last year. Lincoln Park came in second place (down 16.7 percent year-over-year), followed by Avondale/North Center (down 21.7 percent year-over-year) and West Town/Wicker Park (up 40 percent year-over-year).
Although the West Loop saw the fewest home sales compared the other ZIPs, the neighborhood showed a 58.1 percent increase in home sales paralleled to its performance in February 2017.
Despite dropping 11.9 percent since last year, Gold Coast/Streeterville saw the most condo closings in February. River North had the fewest condo closings compared to all the other downtown Chicago neighborhoods and is also down 11.4 percent year-over-year.
Editor’s Note
For 2018, Z Chicago is configuring our neighborhood real estate market updates differently. With the exception of the Loop, which holds eight different ZIP codes, we will now gather and share housing data based on ZIP instead of Census-designated community areas.
Using ZIPs allows for better distinction and more accurate information. The Census/MLS tends to group communities together, such as the “Near North Side,” which encompasses River North, Gold Coast, Streeterville and Old Town. We see it imperative to isolate these neighborhoods to paint a more clear-cut picture. Please note, there is still some (albeit minor) community overlap when using ZIPs, such as 60647 which includes both Bucktown and Logan Square.
Because Chicago condos are the housing type of choice among many (if not most) house hunters in the downtown area and its surrounding neighborhoods, we’ve used condominium activity (attached home sales) for our past Chicago real estate market updates. For this and all future reports, we will also include all residential homes sales data (condo, single-family home, townhome) to help every prospective buyer or seller become more informed on the real estate market. These will be separated into two separate charts for clarity.