The median home price in Chicago for August reached $285,000 – that’s a slight .4 percent increase from August 2017. Still, the market saw a steep drop between July and August. In July, the median sales price was $305,000.
The median condominium price hit $299,950, down 1.7 percent from a year ago. Similar to all residential homes, condo prices dropped between July and August. Back in July, condos in Chicago sold for a median $325,000.
The seasonal drop in home prices is par for the course here in Chicago. Over the past 3 years, home prices peaked in June and fell steadily, hitting a six-month bottom at some point between November and December. Condo prices tend to peak between March and April and drop in the late summer and fall.
Meanwhile, Illinois Realtors’ monthly local market update for the City of Chicago shows a 5 percent dip in inventory since last year with an unchanged median market time. Closed sales dropped 5.1 percent from August 2017.
The city data paints too broad of a picture, which is why it’s critical to evaluate the trends for the specific neighborhood you plan to buy in, at least if you hope to take advantage of a slower market. Many buyers wait until the off-season to purchase a home because prices tend to be lower and the competition less fierce.
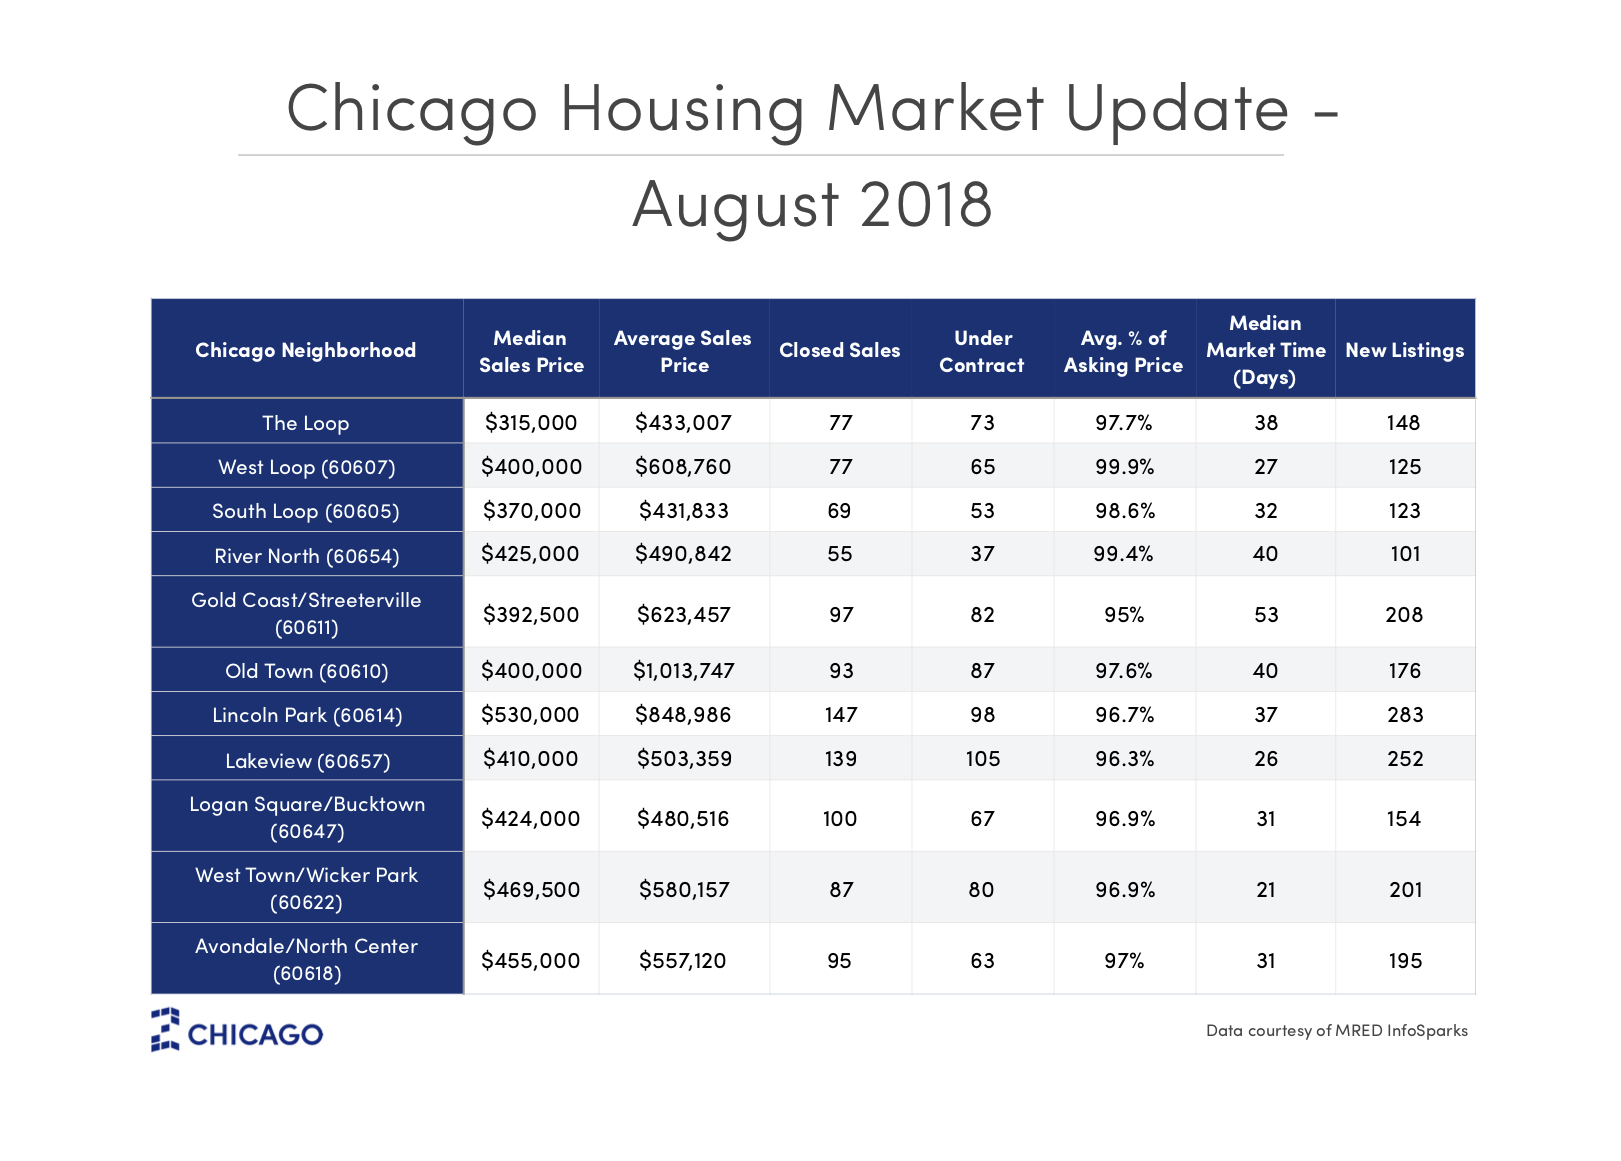
Chicago home and condo prices by neighborhood

August home sales: slower, as usual
In July’s real estate market report, we saw closed sales skyrocket in areas such as the West Loop, South Loop, Lakeview and Avondale. In all of these neighborhoods and beyond, there were fewer closings in August compared to July. This dip is standard when you consider the seasonality of the Chicago real estate market – most buyers starting house hunting in the spring and close in early-to-mid summer. In fact, the only neighborhood with more overall sales (+6) in August compared to July was Logan Square/Bucktown.
Still, monthly changes – particularly this time of year – are somewhat standard in Chicago, so we like to evaluate the annual changes to paint a clearer picture of the current market and the trends currently impacting both buyers and sellers.
Is the real estate market correcting in 2019?
Based on the annual comparisons, this August was slower than last August in almost every neighborhood in some form. Some faced fewer closings, lower prices or slower market times, or a combination of all three. Based on the data, it’s hard to dispute claims that the Chicago real estate market is showing early signs of softening to benefit buyers. Most notably, Chicago homes are taking much longer to sell now than they did just a year ago.
For the West Loop, the 94 closings that took place during the month of July marked the most activity since May 2017, when 98 homes sold in a 30-day period. July’s commotion likely stimulated prices in August, which were up 13.5 percent from a year ago. West Loop condos sold in August were 8.1 percent more expensive compared to last year, too. There were 77 total sales, a marginal increase from last year. Sixty-seven of the homes sold in West Loop last month were condominiums. Although prices and sales are still escalating in West Loop, homes there are sitting on the market longer than they did last year. Homes for sale in the West Loop sat on the market for around 27 days compared to 11 days in August 2017. The median market time for West Loop condos hit 26 days – also up from 11 days last August. The number of new for-sale listings rose 11.6 percent year-over-year – 19 percent for condos alone.
South Loop home sales fell 10.4 percent since last year, which means seasonality might not be the only factor at play. Condo sales in South Loop dropped 6.1 percent year-over-year. The median sales price in South Loop was also down 3 percent (condos down 3.3 percent) from the year prior. Oddly, South Loop that sold in August spent less time on the market than those that sold in July. However, they still moved at a slower pace than they did a year ago. There was a marginal uptick in new South Loop listings, except in the condo market, which dipped a 2.7 percent.
The number of home sales in Lakeview was almost on par with the year prior. Lakeview overall home and condo prices rose 8.2 percent and 5.5 percent, respectively, since last August. Like many other neighborhoods, market time was slower than last August and there were fewer new listings than there were a year ago.
Compared to last August, home sales in Avondale and North Center dropped 16.7 percent. But, July’s strength spilled over into August’s prices, which were up 7.7 percent compared to August 2017. Overall median market time dropped a little bit in the area to a median of 31 days. Condos don’t necessarily dominate the market farther north in a neighborhood like Avondale, but they didn’t perform well in August nonetheless. Closed condo sales fell almost 30 percent compared to last year, costing buyers 4.6 percent less. And, those condos took slightly longer to go under contract compared to condos last August. The number of new listings overall in Avondale and North Center jumped 6.6 percent.
The Loop didn’t have a particularly strong summer overall and August was no different. Closed sales were down 8.3 percent in August compared a year ago. The median sales price also fell by 3.1 percent. Meanwhile, market time rose 52 percent to a median of 38 days with fewer new listings.
Gold Coast and Streeterville closings were down 16.4 percent year-over-year, but sales prices still moved up by 4 percent. Out of all the major downtown neighborhoods, Streeterville and Gold Coast homes typically take the longest to go under contract. Time on the market was up 17.8 percent since last year, so they definitely aren’t selling any faster. Fewer new listings came on the market this August in Gold Coast and Streeterville.
Old Town also had fewer closed sales this August along with a slightly lower median sales price. Market time is up to 60 days compared to 25 days last August, but sluggish sales didn’t discourage sellers. New listings jumped 5.4 percent year-over-year.
Lincoln Park is an outlier. While the aforementioned neighborhoods faced annual dips in the number of closed sales, more Lincoln Park homes sold this August compared to last. Condos seemed particularly popular with a 10.2 percent increase in sales. Overall prices fell 5.4 percent but condo prices jumped 5.4 percent. But, homes sat on the market longer. The number of new listings overall rose marginally while new condo listings dipped slightly.
We mentioned August was an improvement from July in Bucktown and Logan Square, but the annual trend shows a significant drop in closed sales of 12.3 percent. Still, prices overall rose 4.8 percent. But, market time was up to 31 days from 14 days last year. The slowdown might have dissuaded sellers – there were 18.5 percent fewer new listings this August compared to last.
West Town and Wicker Park had an even bigger decline in home sales this August of 28.7 percent. Prices fell just 3.4 percent, but those homes took a median of 21 days to go under contract. That’s a pretty significant jump from the 14-day average last August. New listings rose 8.1 percent in August.
What does this mean for home sellers?
Unless absolutely necessary, listing your home for sale in the fall is rarely a good idea. Interest rates are rising and will likely impact the number of interested buyers, but we believe the strong spring market is enough to outweigh this. Sellers next spring might not be in multiple offer scenarios as often, but they will probably fare better than they would this time of year.
Sales in most major neighborhoods near downtown Chicago tend to perform the weakest in November of any month over the year. Listing now and planning for a 45-day closing period might put you at risk of falling into that November slump trend.
The biggest takeaway for sellers is the need for patience. Your home might take longer to sell than your neighbors did last year or the year prior, but that doesn’t necessarily mean you’re going to net less. Home prices are still rising, but now at a slower and more steady pace.


