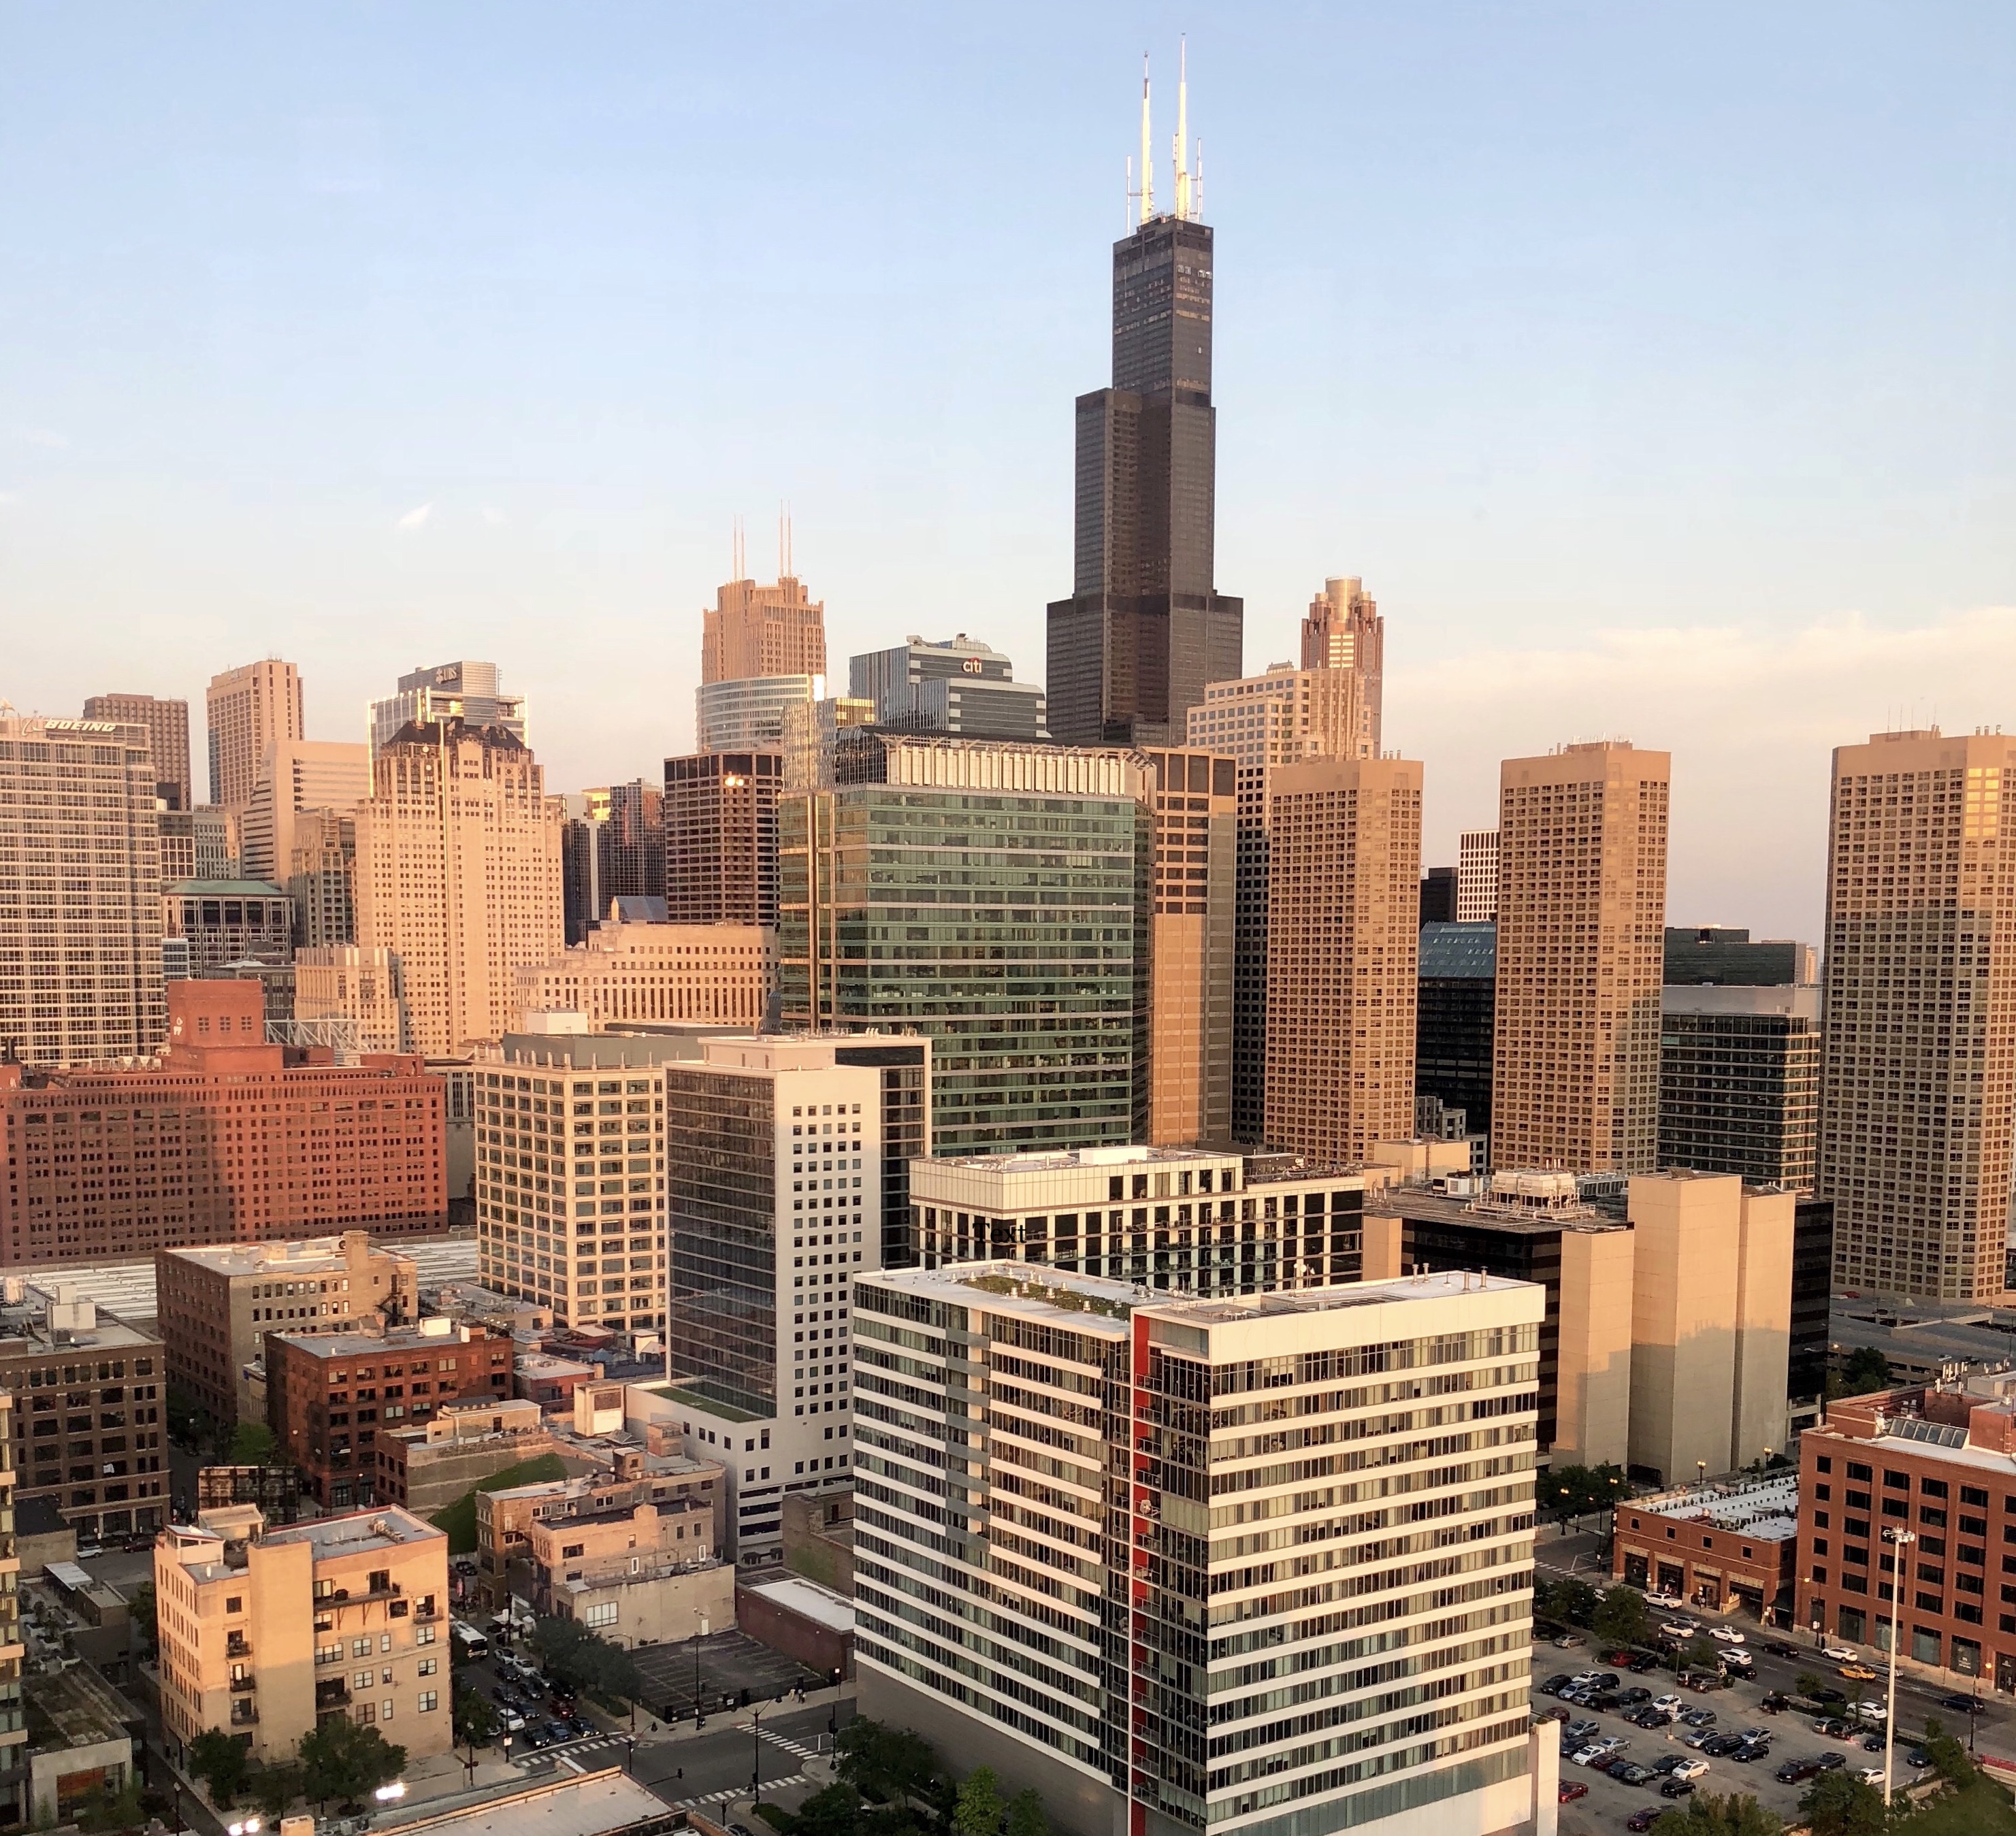
Chicago’s November home sales illustrate rising prices, but demand and urgency among home buyers are slowing on an annual scale.
In Chicago, the median sales price hit $262,000 in November, up 2.3 percent from last year and down slightly from last month, as is to be expected as winter approaches. Meanwhile, the median condo price in Chicago, now $300,000, rose by 2 percent year-over-year but remained flat from last month.
Market time, on the other hand, did not favor home sellers in Chicago. The median time on the market for Chicago homes sold in November was 48 days, up from 42 days last year and 43 days the month prior. Condos took even longer to sell at a median 49 days. That’s an increase of 28.9 percent year-over-year as the median market time among Chicago condos for sale was 38 days last November. In October, the median market time was 43 days.
Chicago overall home and condo sales fell 7 percent and 8.9 percent year-over-year, respectively.
Once again, it appears as though Chicago is entering the beginning stages of a real estate market shift – one that favors home buyers. In 2019, we might see a greater impact of lessening home buyer demand in the way of subsiding price growth and even longer market times.
Take a look at how November home sales played out in some of Chicago’s most in-demand neighborhoods:
Chicago home sales by neighborhood: 2017 vs 2018


The Loop, Chicago
- Home prices in the Loop rose 20.4%
- Market time in the Loop fell 23.2%
- Closed sales fell 4.4%
- New listings fell 23.2%
West Loop, Chicago
- West Loop home prices fell 20%
- West Loop market time rose 4%
- Closed sales fell 34%
- New listings fell 31.6%
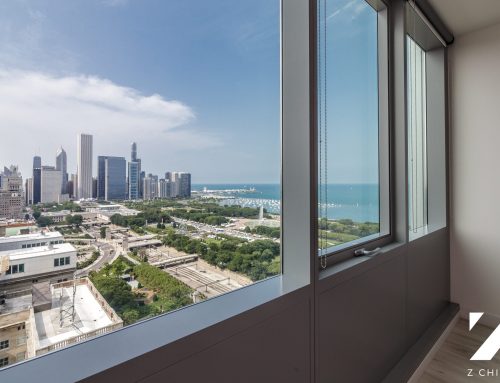
South Loop, Chicago
- South Loop home prices rose 7.5%
- Market time remained flat
- Closed sales remained flat
- New listings fell 25.3%
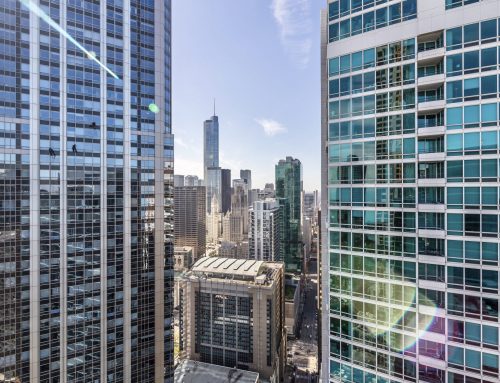
River North, Chicago
- River North home prices fell 6.8%
- Market time rose 57.9%
- Closed sales fell 43.6%
- New listings remained flat
Gold Coast/Streeterville, Chicago
- Gold Coast and Streeterville home prices fell 25.3%
- Market time rose 62.5%
- Closed sales fell 5.7%
- New listings rose 10.6%
Old Town, Chicago
- Old Town home prices rose 5.8%
- Market time fell 7.3%
- Closed sales rose 16%
- New listings rose 38.8%
Lincoln Park, Chicago
- Lincoln Park home prices rose 0.3%
- Market time rose 9.5%
- Closed sales 20.5%
- New listings fell 8.8%
Lakeview, Chicago
- Lakeview home prices rose 26.6%
- Market time fell 29.3%
- Closed sales fell 15.6%
- New listings fell 2.9%
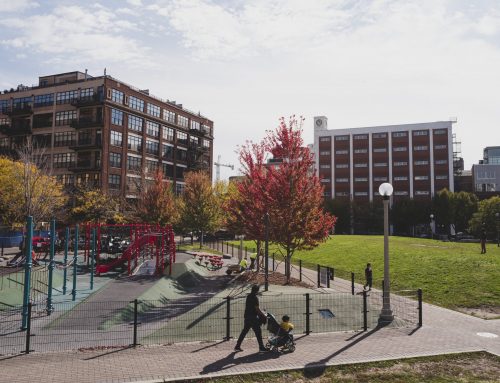
Logan Square/Bucktown, Chicago
- Logan Square and Bucktown home prices rose 13.3%
- Market time rose 68%
- Closed sales fell 24.1%
- New listings fell 3.9%
West Town/Wicker Park, Chicago
- West Town and Wicker Park home prices fell 2.2%
- Market time rose 62.5%
- Closed sales rose 7.7%
- New listings rose 1%
Avondale/North Center, Chicago
- Avondale and North Center home prices fell 14.2%
- Market time rose 57.6%
- Closed sales fell 18.1%
- New listings fell 22.7%
Homes selling faster in Old Town, Lakeview, the Loop
Market time rose in nearly every major Chicago neighborhood except Old Town, Lakeview, and the Loop, where homes sold faster this November compared to a year ago. In South Loop, market time remained flat year-over-year.
Old Town had a particularly strong November. Not only did homes sell 4 days faster compared to last year, but Old Town home prices were also up 5.8 percent year-over-year, reaching a median $363,750. Last month, Old Town home sellers sold for 95.5 percent of their original asking price.
Lakeview homes sold 12 days faster last month than they did a year ago and prices were up 26.6 percent in the same time period. However, closed sales and new listings in Lakeview dipped 15.6 percent and 2.9 percent, respectively.
In the Loop, market time was down 23.2 percent, now at a median 74 days. Despite the acceleration, the Loop still holds the second lengthiest median market time in the city behind Gold Coast and Streeterville. Closed sales and new listings in the Loop were down, but prices rose a substantial 20.4 percent.
What’s happening to Chicago’s “hot” neighborhoods?
Chicago’s most talked about neighborhoods in terms of demand and development also had the roughest month in terms of real estate prices and sales. For example, West Loop’s incredible run stalled in November with substantial dips in the median sales price, number of closed sales and number of homes under contract. West Loop homes took 2 days longer to sell in November compared to a year ago. West Loop’s market time has been fluctuating substantially all year, hitting an annual low in September at 8 days. Compared to last month (and March’s) median market time of 52 days, it’s getting difficult to predict how long a West Loop condo, townhouse or single-family will take to sell.
Logan Square and Bucktown have also seen their fair share of new development in recent years. Although home prices were up last month in both, homes are taking a leisurely pace to sell this year – 37 days compared to just 21 days last year. Logan Square and Bucktown closed sales softened by almost a quarter while new listings dipped almost 4 percent.
Avondale and North Center home sellers are also seeing their listings sit decidedly longer this year. The median market time grew to 52 days in November from 33 days last year. Closed sales were down 18.1 percent and new listings almost 23 percent year-over-year.
Is it a coincidence that these three submarkets are also ripe for new construction? Could an oversupply of new builds feed a more sluggish fall/winter market?
Diving deeper into the data, the ZIP that encompasses both Avondale and North Center saw a 150% increase in new construction listings year-over-year. Logan Square and Bucktown new construction listings rose 109.5 percent.
Somewhat of an outlier, new construction homes for sale in West Loop were down 85 percent – they reached their 3-year peak in June 2017. Still, the area has seen its fair share of new construction rentals this year.
Perhaps sales are down in West Loop because potential first-time buyers are gravitating toward leasing a luxury apartment since the barrier of entry is so much lower. Both rising prices (West Loop condos hit their highest median price in history this past February at $595,000) and recent mortgage rate hikes can certainly stall homeownership dreams.
Want to discuss the market one-on-one with an expert? Contact Z Chicago to get a personalized, no obligation home buying consultation today.
