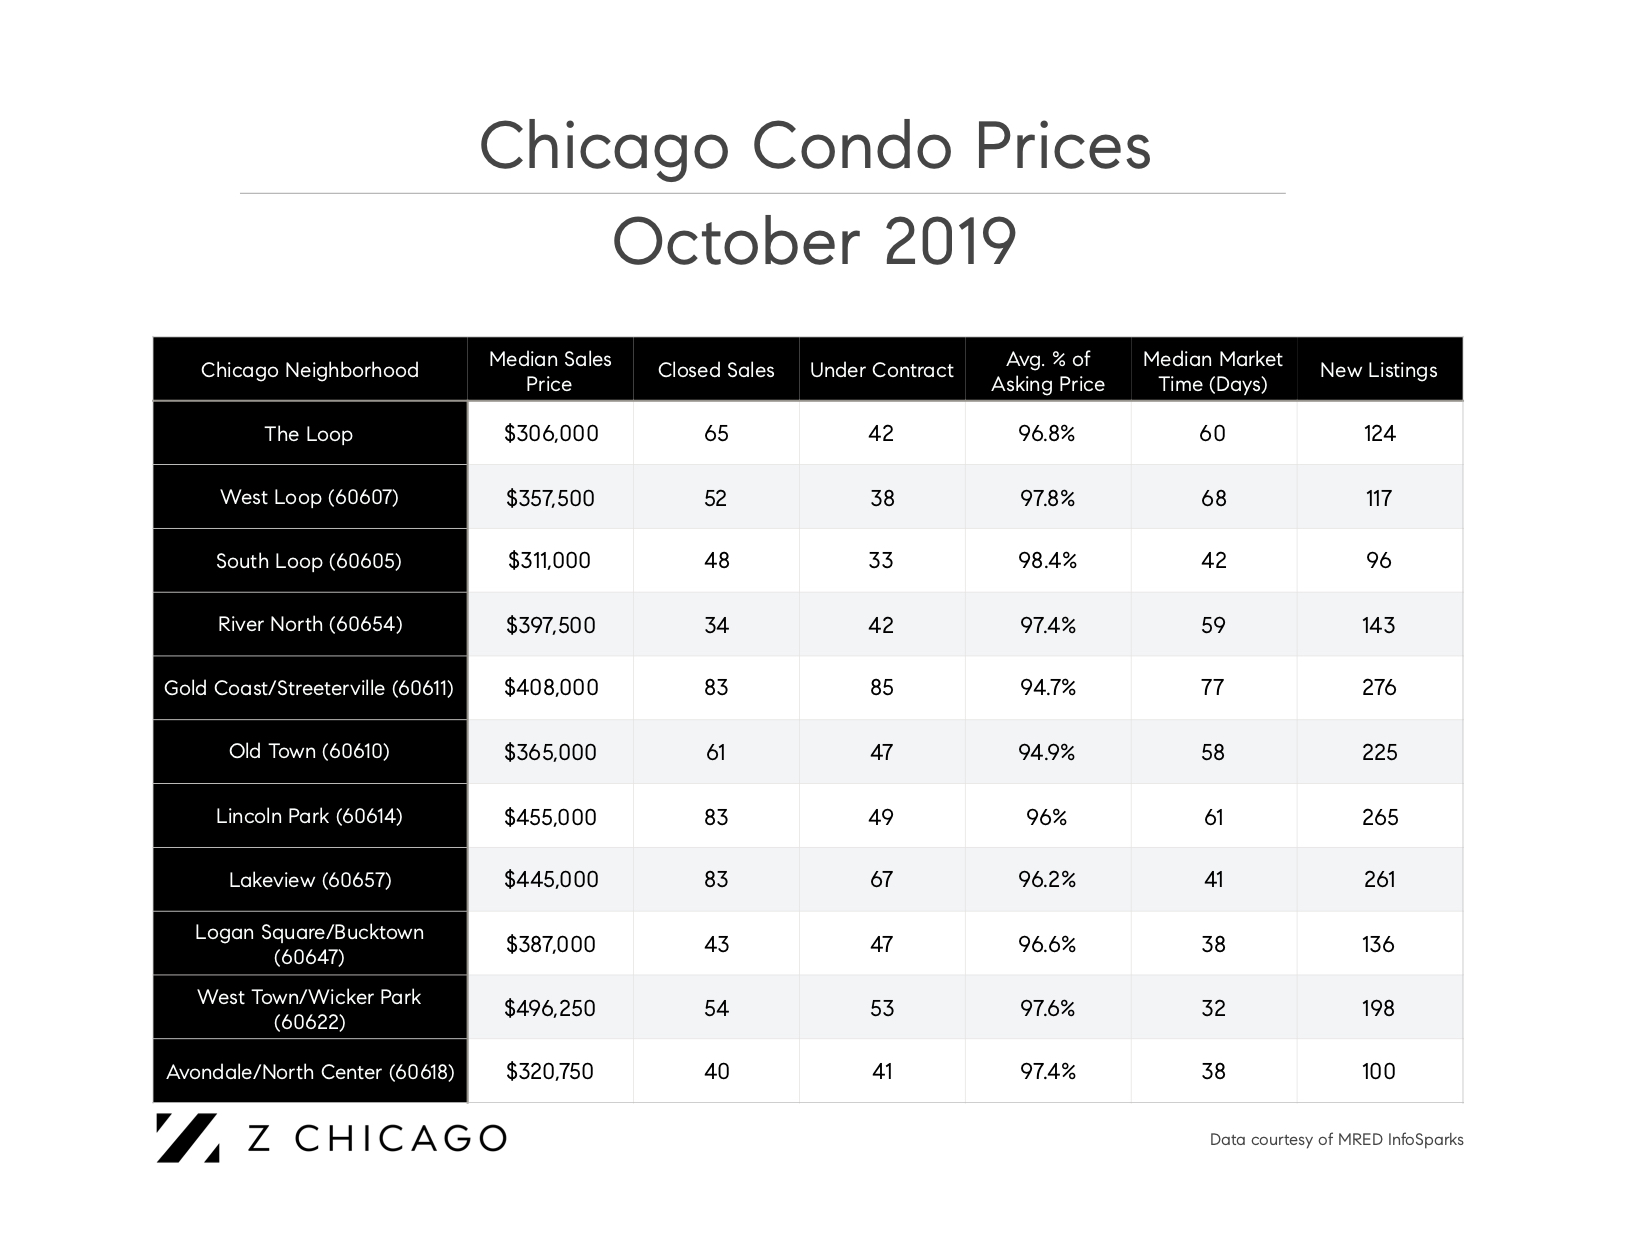
Despite the reports that Chicago’s market is dwindling, home prices are still on the rise. Chicago residential homes reached a median price of $292,250 in September, an increase of 2.5% compared to a year ago. Condo prices rose even higher with an annual spike of 4.9%, settling at a median price of $320,000 for all condos sold across the city in September.
While it’s true that Chicago’s real estate market might not be as red hot as it was in 2017, or even 2018, home values continue to climb. That said, there are some facets of the market that indicate what we, and many other real estate professionals, view as a market normalization – not a housing recession.
First, the median market time – or the number of days between when a home is first listed to when it goes under contract – was 41 days for all residential sales last month. In September 2018, Chicago homes spent a median of 37 days on the market before going under contract. In September 2017, homes took just 30 days to go under contract. Homes take longer to sell now than the Chicago market is accustomed to due to overwhelming demand in recent years. What’s more, closed sales in Chicago fell 2.9% year-over-year in September.
Despite slower and fewer sales, one reason home prices in Chicago are still climbing is that inventory is low, which could also account for fewer sales. Low supply is a defining force behind a seller’s market, of which Chicago is still marginally leaning toward depending on the neighborhood at hand. The number of homes for sale in Chicago is down 3.8% since last year. However, for sale inventory among condominiums is up 4% year-over-year.
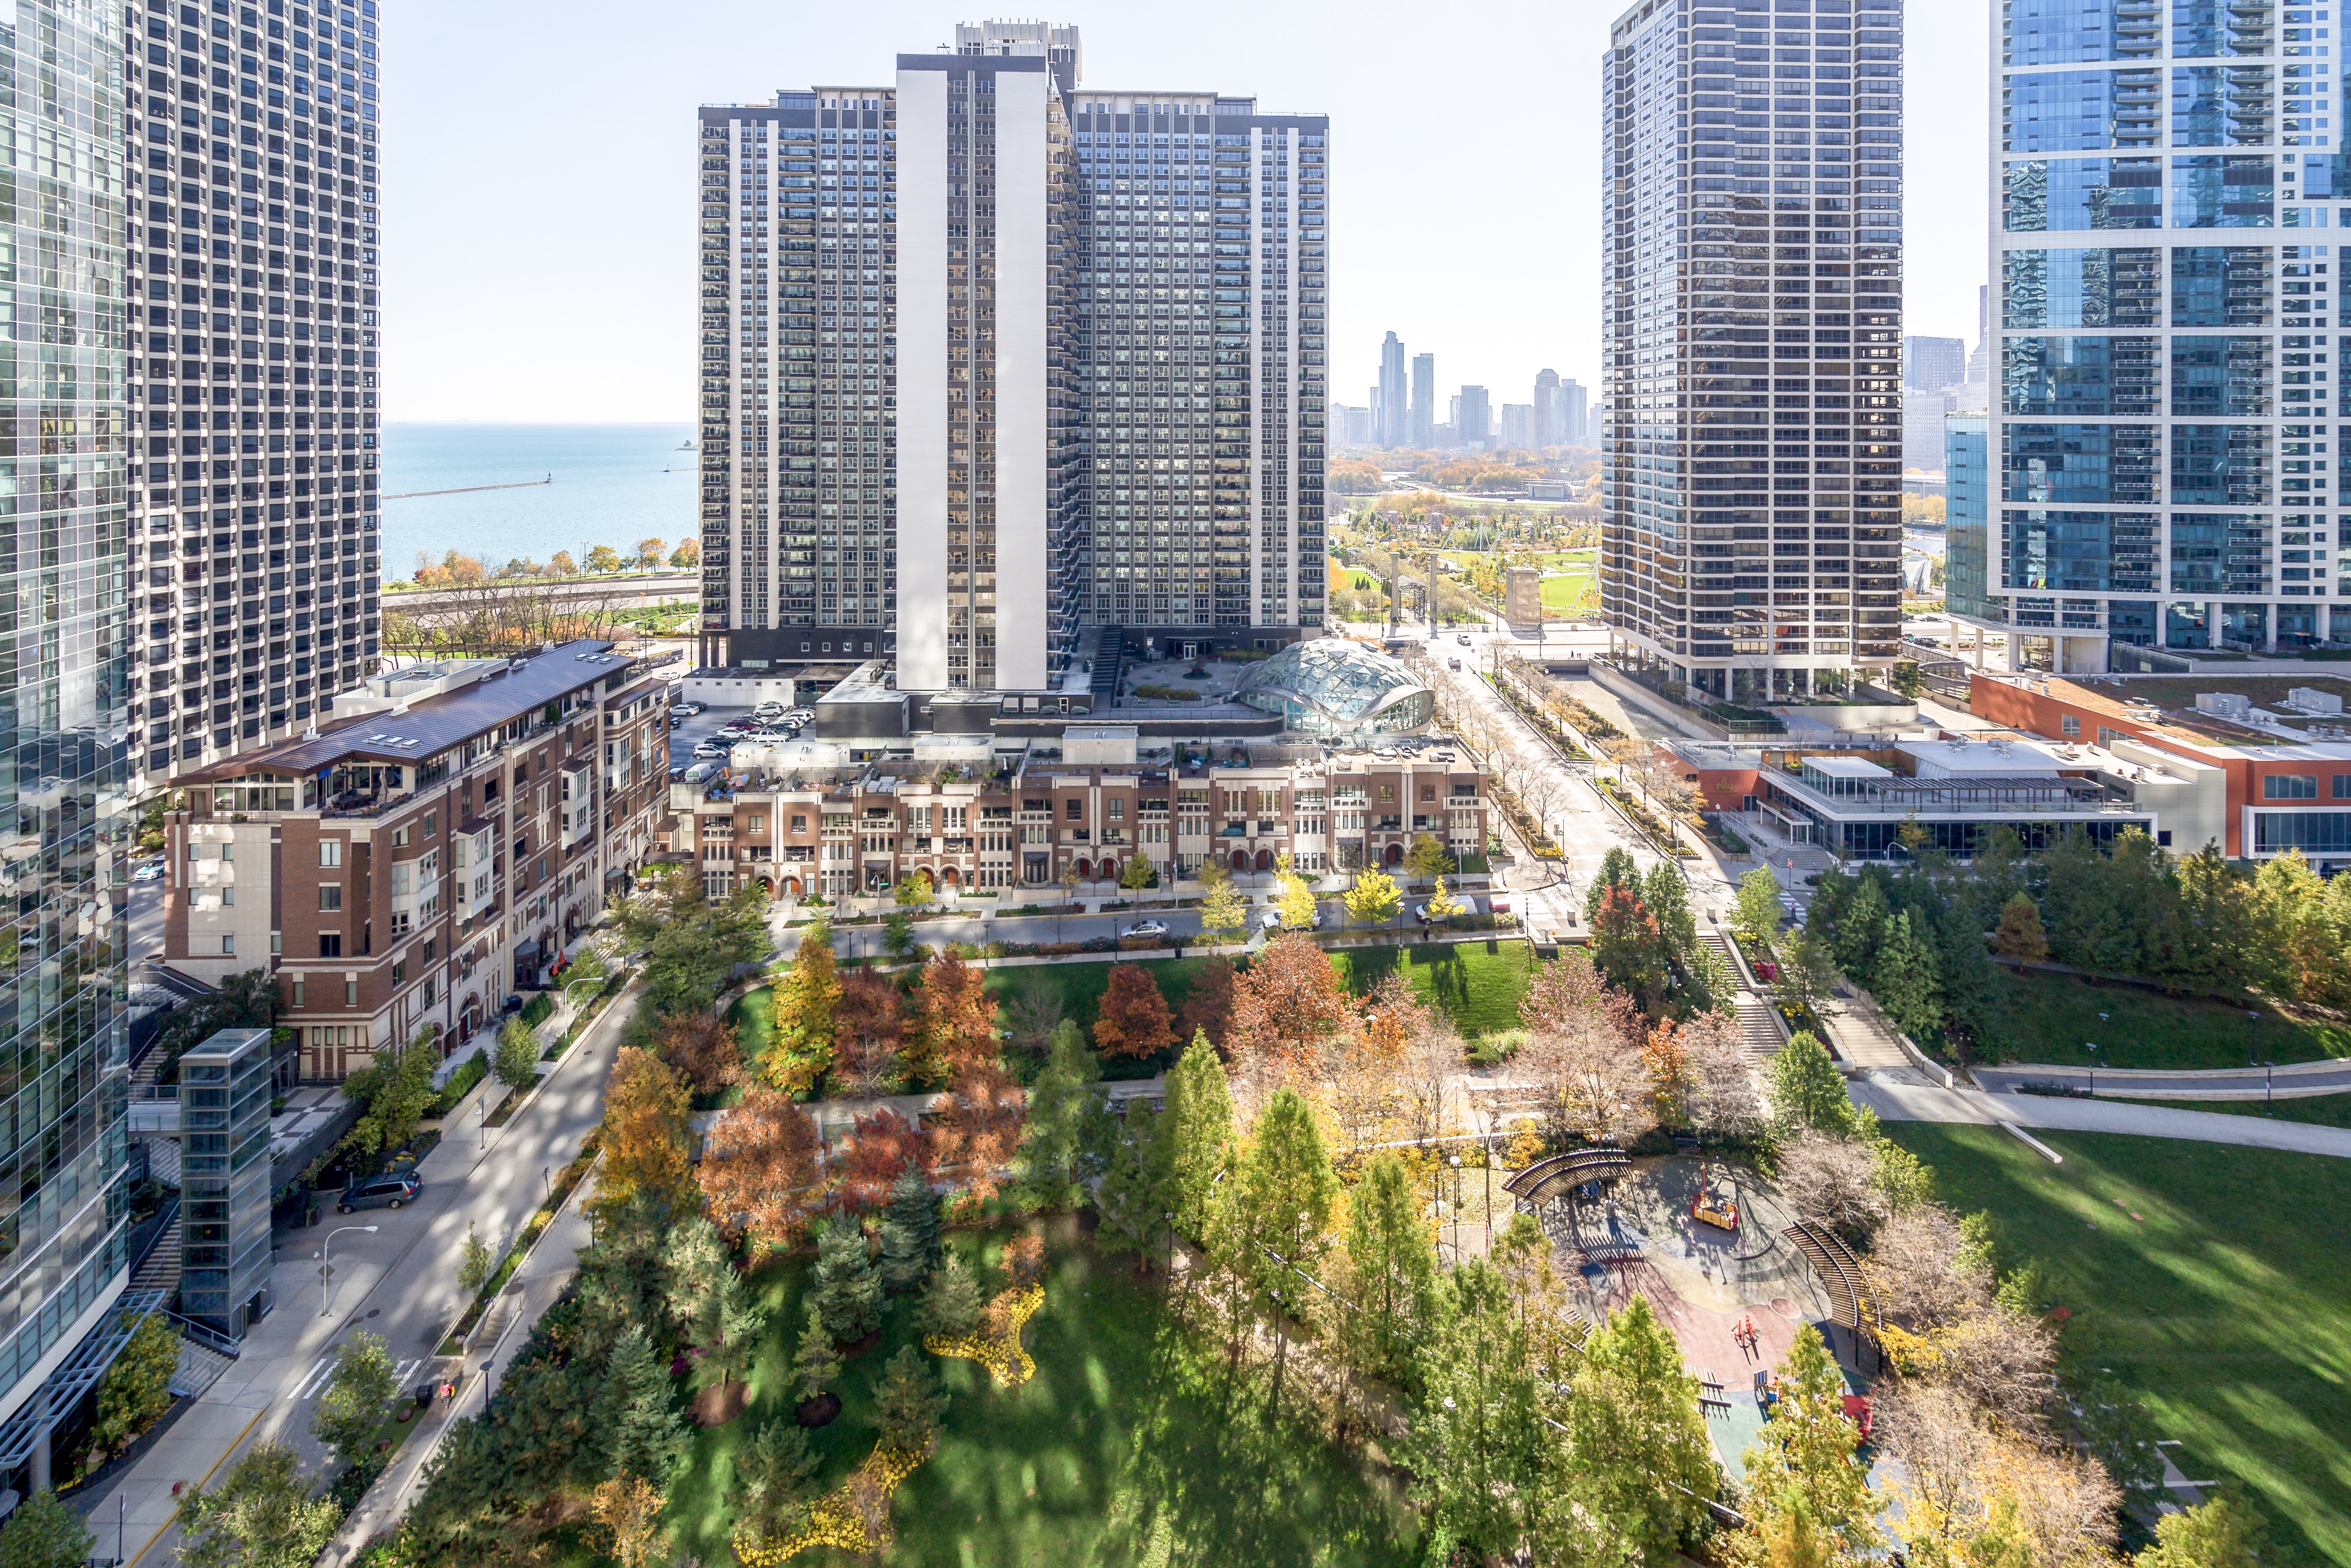
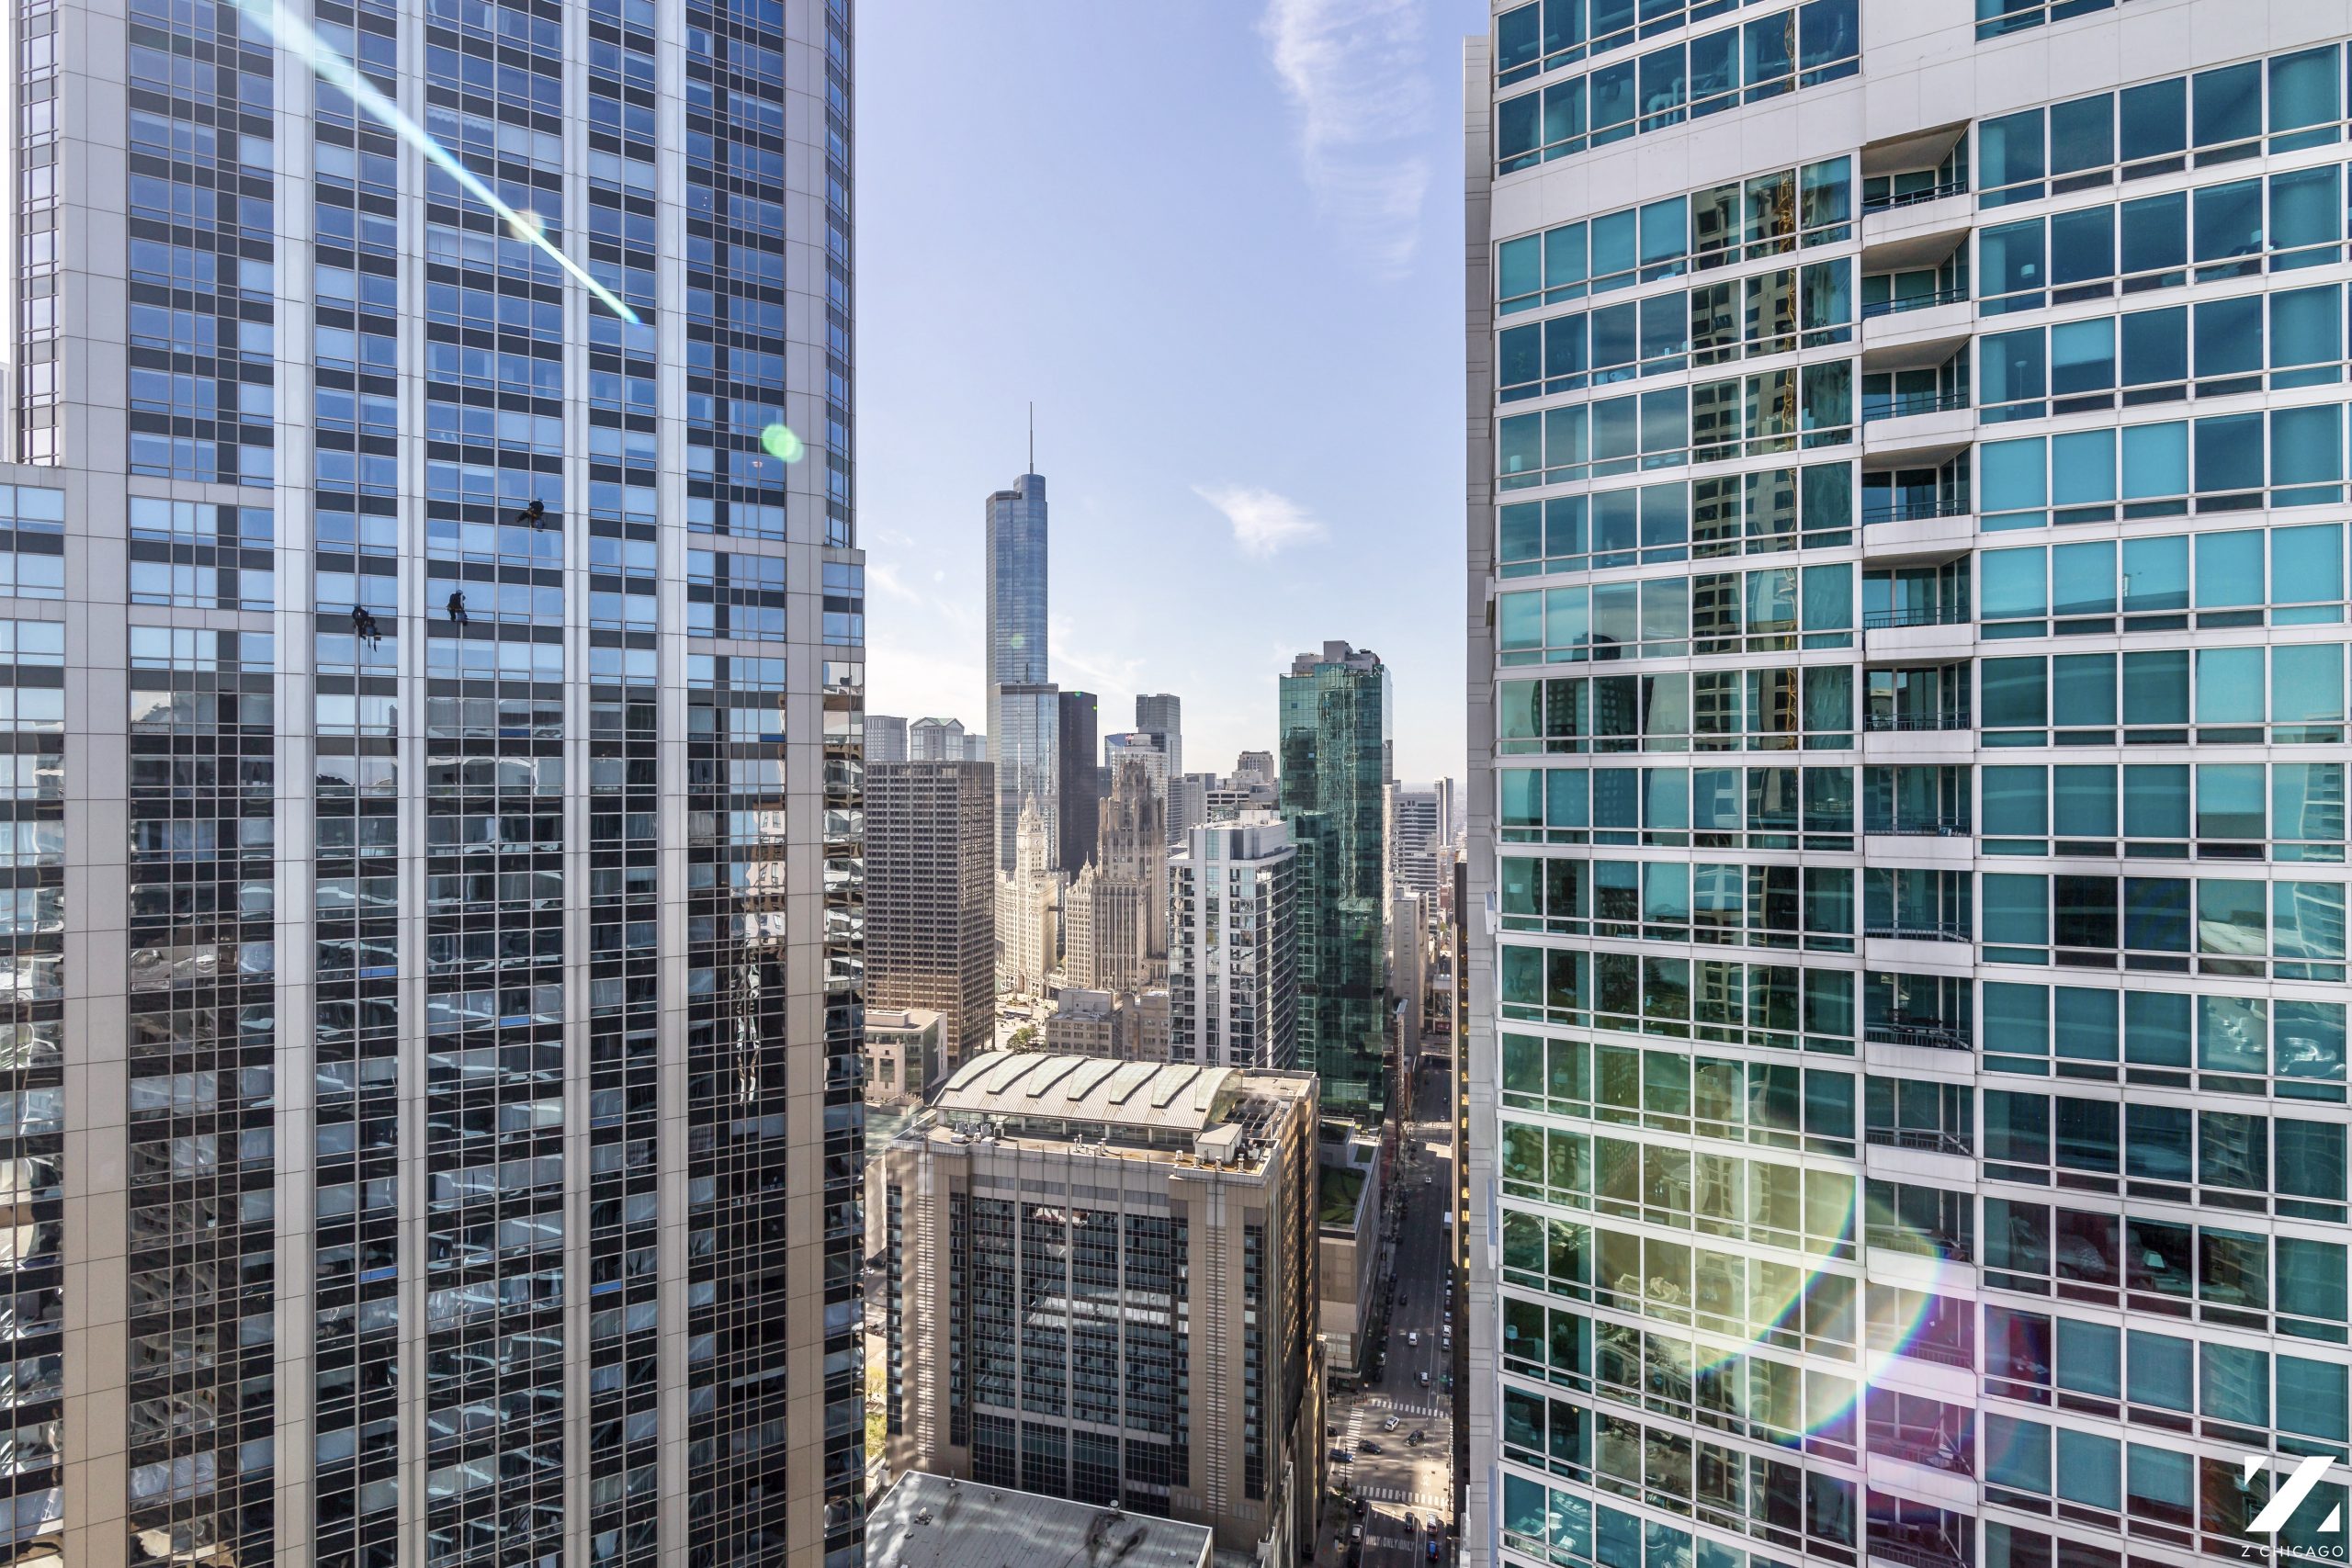
Chicago home and condo prices by neighborhood
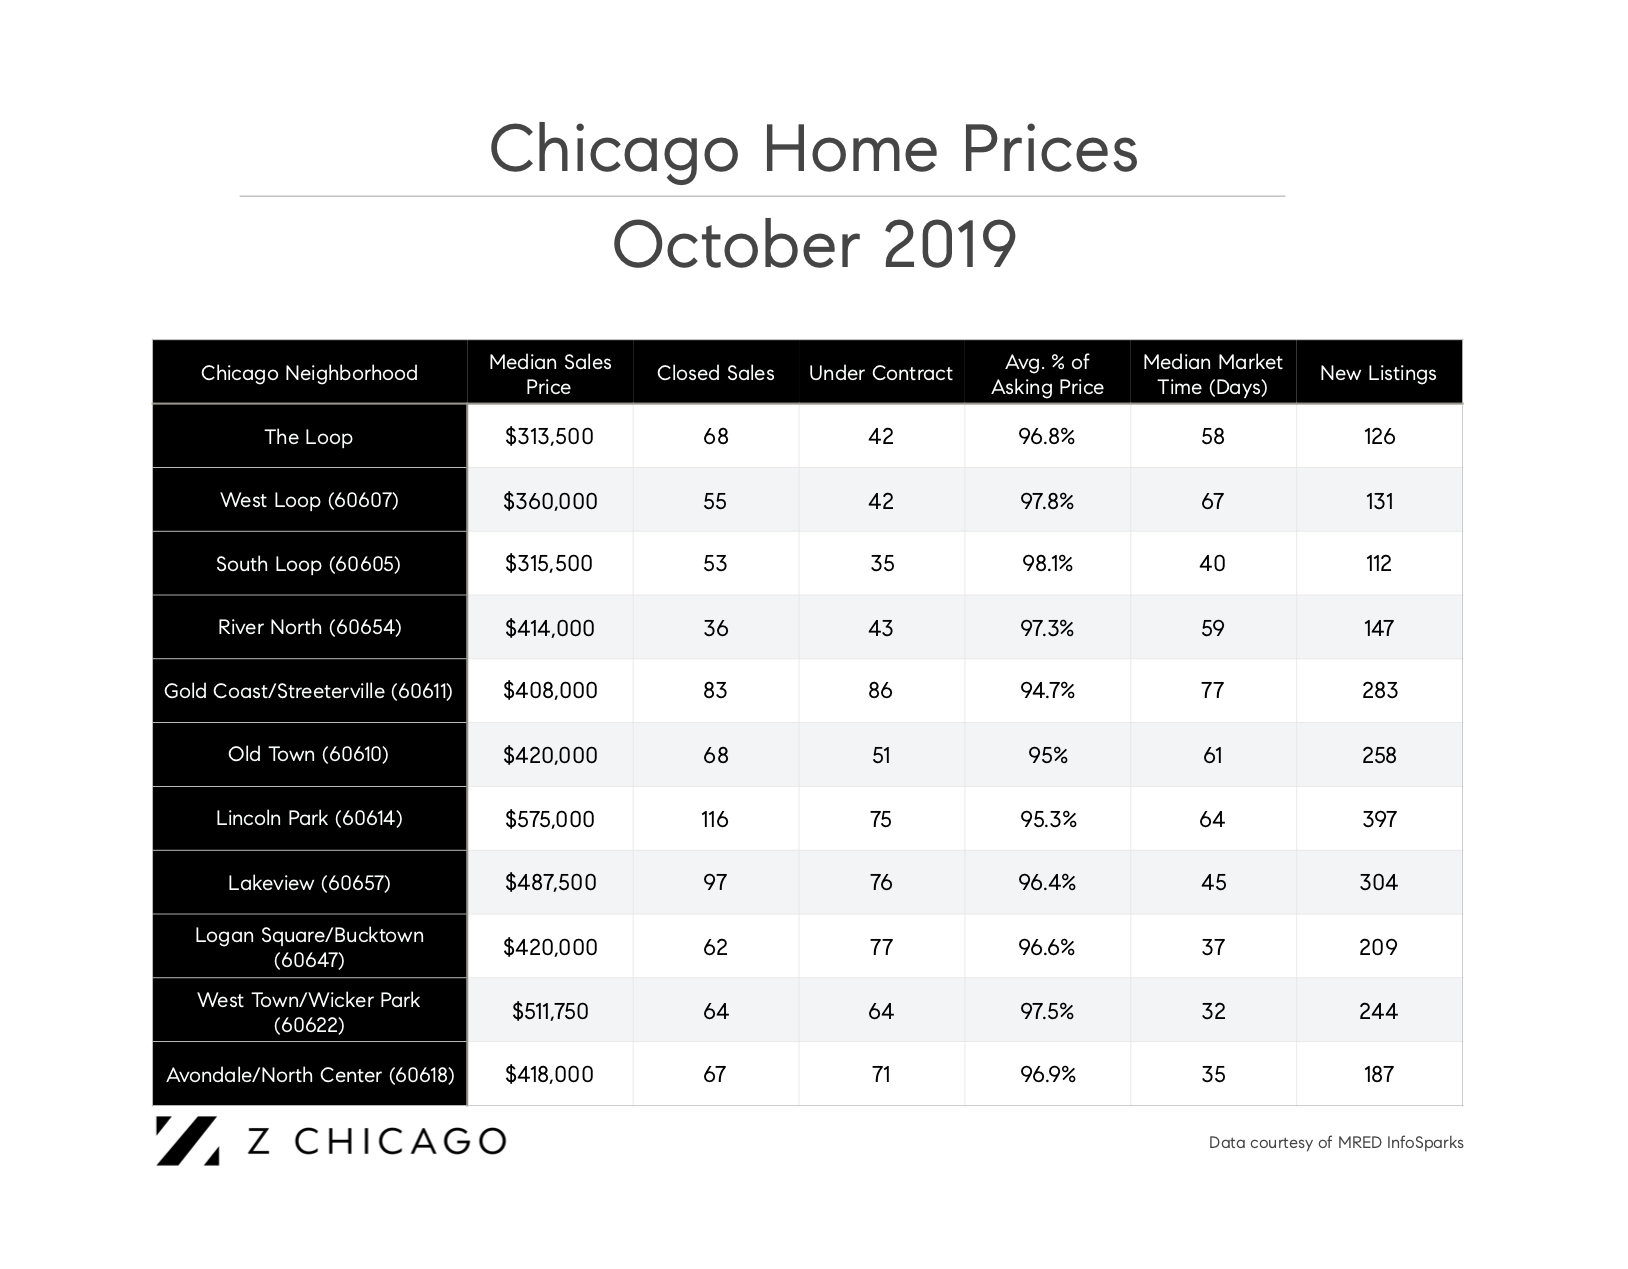
Which Chicago neighborhoods are less expensive for homebuyers?
Despite being pegged as one of Chicago’s most expensive neighborhoods, West Loop homebuyers who closed in September shared a median price that was the third least expensive of all downtown neighborhoods we surveyed.
West Loop home prices tumbled 35.7% in September compared to last September, when the median hit $560,000. Keep in mind, September 2018 was a month with the second-highest home prices in the West Loop for the year (second to February 2018) and the data was likely inflated due to new construction sales. Adjusting to account for resale properties only, the West Loop median home price was $356,000 last month compared to $420,000 last September, illustrating a less severe drop of 15.2 percent.
The most severe change for the West Loop is the time it takes to sell a home. Market time in the West Loop is up a whopping 737.5% to 67 days. Last September, the median time on the market for homes in the West Loop was just 8 days.
On the flipside, River North home prices grew 9.7% year-over-year in September from a prior $377,500. The median time to sell a River North home reached 59 days compared to 53 days a year ago.
Old Town is another neighborhood where prices were higher this fall compared to last fall. The median sales price is up 9.4% year-over-year, and market time for homes in Old Town was just three days longer compared to September 2018.
Meanwhile, Lakeview had a home price boost of 9.4% but a median market time that grew 17 days compared to a year ago.
All other neighborhoods surveyed had home prices fall between 2.5% (West Town) to 24.1% (South Loop and Gold Coast/Streeterville). To see more annual changes by neighborhood, check out our September 2018 Chicago real estate market report. To speak with a Z Chicago – Compass agent about buying or selling, contact us today.
