
Keeping up with the fast-paced Chicago real estate market is a wise choice for those looking to buy or sell a home in 2018. We round up the latest residential sales data from the MLS every month for each major downtown neighborhood to shed light on everything from the current conditions to neighborhood discrepancies and year-over-year market growth. Our goal is to release highly comprehensive market reports that help our readers make more informed real estate decisions now and in the future.
We’ll start with the broad overview. Illinois Realtors recently released its monthly local market update for February 2018. Home sales in the City of Chicago fell 2.6 percent year-over-year in February. The number of Chicago homes for sale concurrently dropped 9.6 percent compared to the year prior. Meanwhile, the median sales price rose 10.6 percent to $272,000 from a prior $246,000 last year. Time on the market remained the same as it was in February 2017 at 56 days.
We can also gather more updated data directly from MRED, this time for March 2018. Chicago’s residential median sales price (townhomes, single-family homes and condominiums) was $287,000 last month – a 4.3 percent increase from the year prior. Condos specifically reached a median sales price of $316,000 in March, up 3.6 percent from March 2017. These numbers are based on a 12-month rolling average to minimize the impact of intermittent large sales.
Which Chicago neighborhoods are more (or less) expensive?
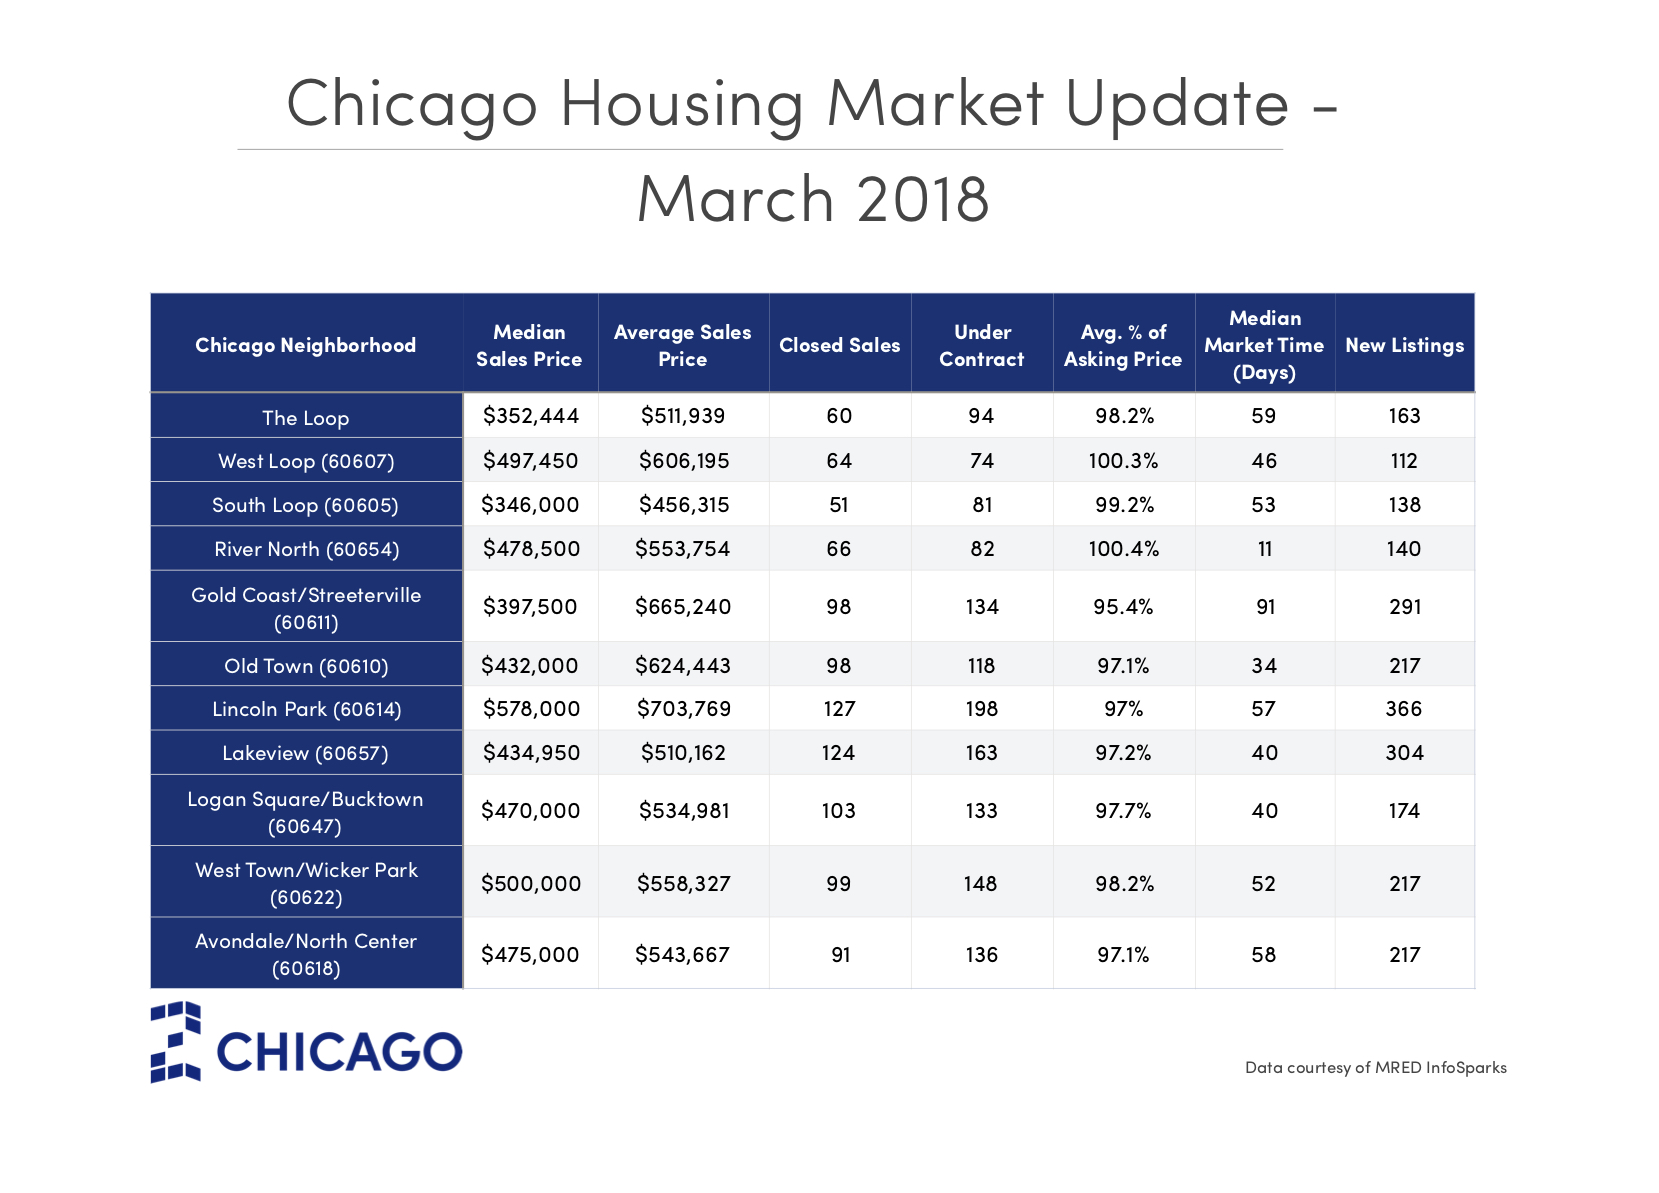
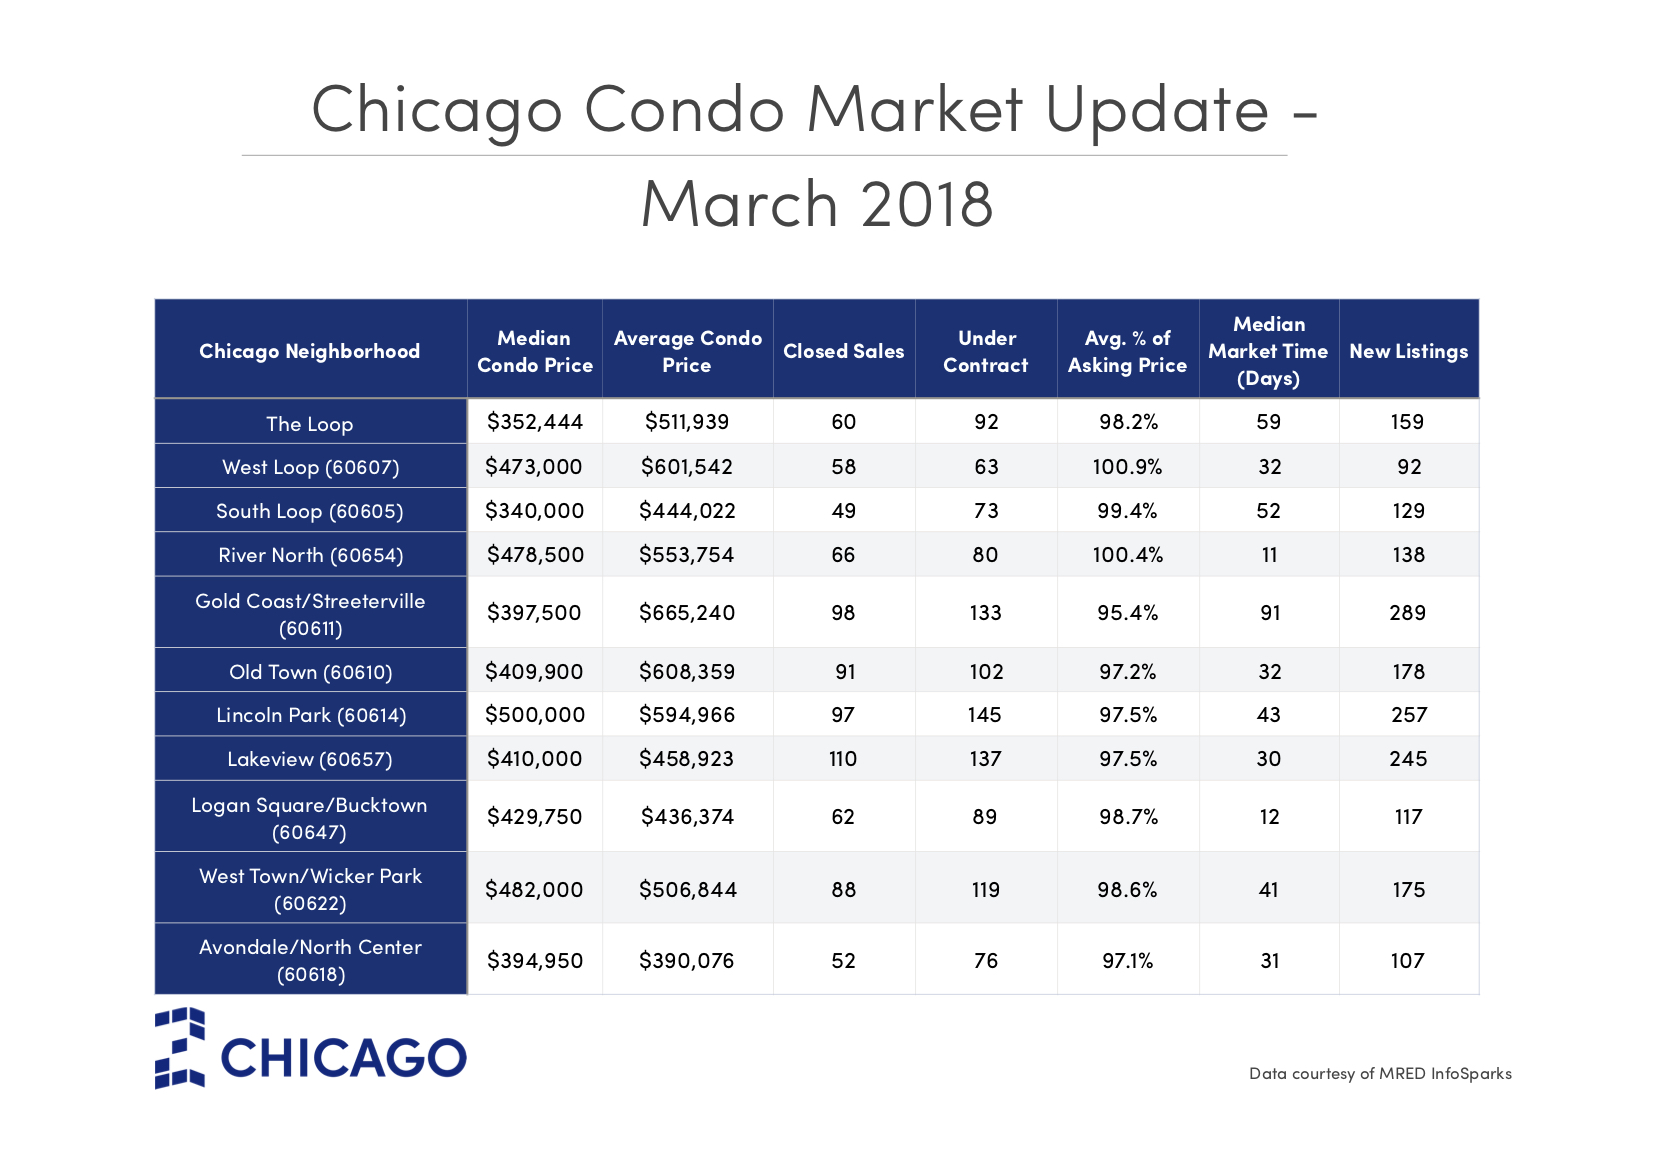
In notable but expected surges, the West Loop saw a 30.9 percent year-over-year increase in its overall residential sales price in March. West Loop condo prices rose a lesser, yet equally impressive, 24.8 percent during the same time frame. In Avondale and North Center, home prices rose 10.1 percent while condo prices jumped 22.7 percent. River North homes and condos had an equal 15.3 percent sales price lift.
Lincoln Park home prices illustrated a slight boost of 1.4 percent since March 2017 – a superior 3.6 percent jump when isolating the area’s condo market. Overall residential sales prices in West Town and Wicker Park jumped 5.3 percent, with condo prices increasing a lesser 3.1 percent since March of last year.
Let’s also consider which neighborhoods were less expensive this March than last year. Both general residential and condo prices in South Loop dropped 8.2 percent from the year prior. The same dip occurred in the Loop, although sales prices there were still slightly higher than those within South Loop. Residential prices also fell in Gold Coast and Streeterville by 7 percent, showing a 6.5 percent price drop for condos alone. Home prices in Old Town also fell 3.5 percent, while Old Town condo prices fell 4.5 percent.
Not every submarket sees home and condo prices move parallel to one another. Lakeview home prices fell 2.6 percent, but Lakeview condo prices rose 10.7 percent. Homes sold in Logan Square and Bucktown for 3.2 percent less than last year while the local condo market saw a price increase of 14 percent.
The number of homes for sale in Chicago
Over 7,600 Chicago homes were on the market last month, which is 10.7 percent fewer from last year. However, the number of Chicago condos for sale jumped 1.7 percent year-over-year with 4,130 listings.
Fewer homes (not condos) came on the market in March 2018 compared to March 2017. There were 5,300 new listings last month, which is 2.6 percent less than the year prior. Over 3,000 of those were new condos for sale, a segment of the market that has grown 1 percent since last year.
Housing inventory is a nationwide issue at the moment and Chicago is no exception. However, the recent data points to a slight boost in condo inventory specifically, which could ease the process for first-time homebuyers who have (for the past few years, at least) struggled with locating the right home while it’s still on the market and dodging competing offers. Some real estate experts believe the hot seller’s market Chicago has become accustomed to will begin to cool off at some point in the next few years, in part thanks to rising interest rates. As of April 4, the average 30-year fixed rate was 4.55 percent compared to 4.24 percent one year ago.
The hottest Chicago neighborhoods right now
Ranking first for most residential closings was Lincoln Park, despite the number of homes sold in the north side neighborhood tumbling 13.6 percent since last year. Lakeview was a close second for most residential closings, nonetheless down 8.1 percent year-over-year.
Meanwhile, Lakeview earned the title for most condo closings specifically. The number of Lakeview condos sold in March marked a 3.5 percent increase from the year prior.
In terms of notable annual increases, the number of homes and condos sold in River North last month rose a stunning 46.7 percent year-over-year. The number of West Loop homes sold increased 12.3 percent (3.6 percent for West Loop condos).
And, for notable decreases, there were 25.4 percent fewer homes sold in Avondale and North Center last month with a 16.1 percent drop in the condo market alone. The South Loop also showed 17.7 percent fewer residential closings and 15.5 percent fewer condo closings. In addition, the number of homes and condos sold in the Loop dropped 11.1 percent.
Editor’s Note: Unlike the citywide overview above, the neighborhood-specific data shown above is not based on a 12-month rolling average but pulled based on month-by-month activity. That means that the sales price in March is based on the actual sales that took place in March and not averaged out over the course of a year. We’d also like to note that we’ve changed our data table to include median market time instead of the average market time to paint a more accurate picture of how long homes typically sit on the market.
